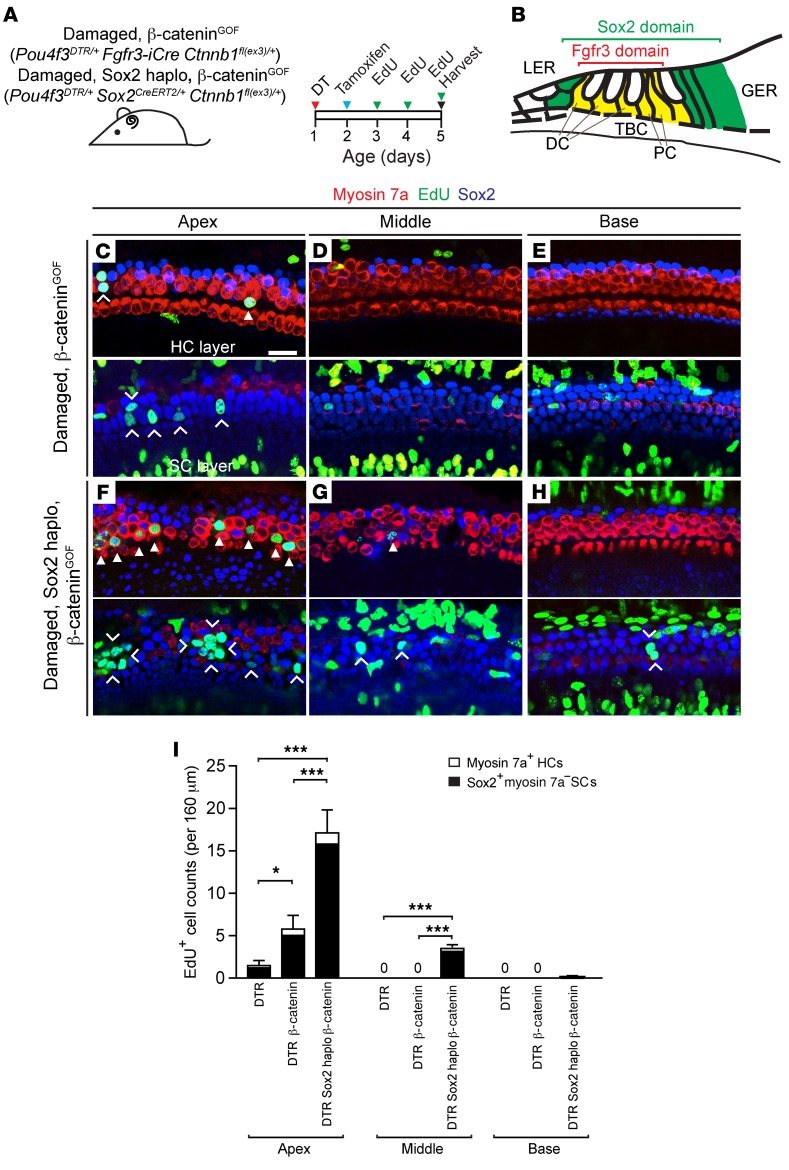
Figure 4. β-Catenin stabilization and Sox2 haploinsufficiency coordinate to increase mitotic regeneration in the damaged neonatal mouse cochlea.
(A) Pou4f3DTR/+ Fgfr3-iCre Ctnnb1fl(ex3)/+ and Pou4f3DTR/+ Sox2CreERT2/+ Ctnnb1fl(ex3)/+ pups were injected with DT on P1, tamoxifen on P2, and EdU daily (P3–P5), and cochleae were collected on P5. (B) Schematic depicting the domains of Fgfr3 and Sox2 expression in the neonatal mouse cochlea. (C–E) Confocal images of cochleae from P5 Pou4f3DTR/+ Fgfr3-iCre Ctnnb1fl(ex3)/+ mice showing EdU+myosin 7a+ hair cells (arrowhead) and EdU+Sox2+ supporting cells (chevrons) in the apical turn, but not in the middle or basal turn. Note that many EdU+Sox2– cells resided outside the sensory epithelium. (F–H) In Pou4f3DTR/+ Sox2CreERT2/+ Ctnnb1fl(ex3)/+ cochlea, there was a robust increase in the number of EdU+myosin 7a+ hair cells (arrowheads) and Sox2+ supporting cells (chevrons) in the apical turn. As with Pou4f3DTR/+ Sox2CreERT2/+ cochlea, EdU+ supporting cells were noted in the middle turns and occasionally in the basal turns. Many EdU+Sox2– cells outside the sensory epithelium were also noted. (I) Quantification of EdU+myosin 7a+ hair cells and EdU+Sox2+ supporting cells in Pou4f3DTR/+, Pou4f3DTR/+ Fgfr3-iCre Ctnnb1fl(ex3)/+, and Pou4f3DTR/+ Sox2CreERT2/+ Ctnnb1fl(ex3)/+ cochleae. Data represent the mean ± SD. *P < 0.05 and ***P < 0.001, by 1-way ANOVA with Holm-Sidak multiple comparisons test. n = 3–5. Scale bar: 20 μm.

