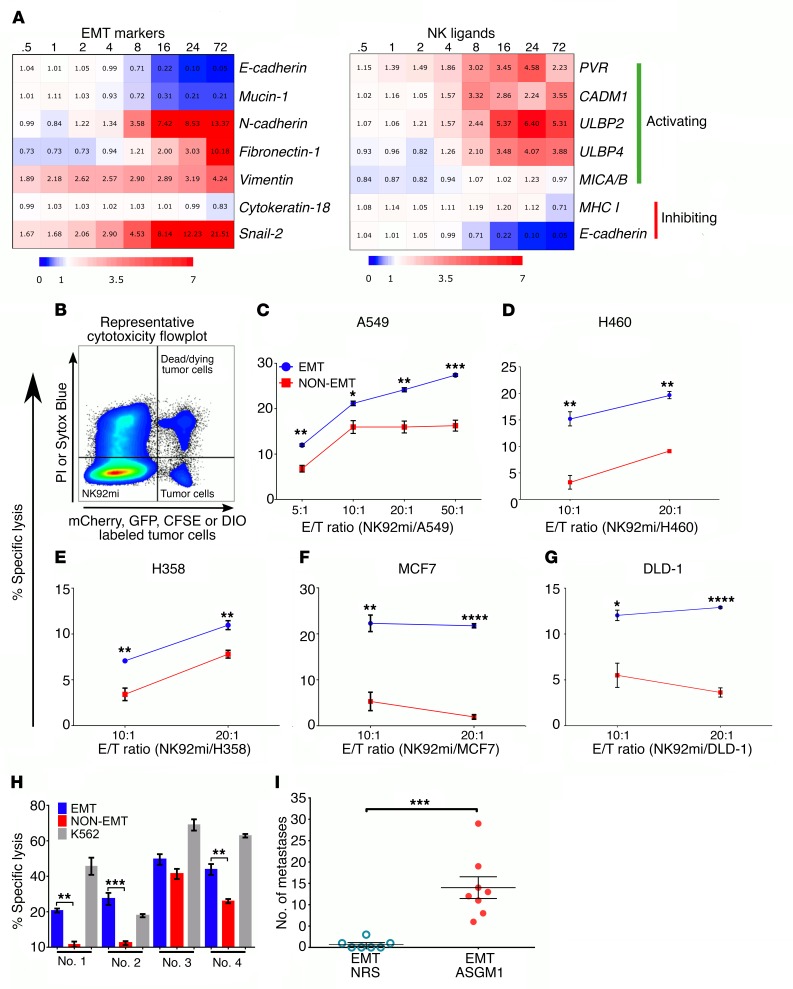
Figure 1. EMT differentially regulates NK ligands and promotes susceptibility to NK-mediated cytotoxicity.
(A) Heatmap (blue: downregulation; red: upregulation) representing fold changes, from 0 hours to 72 hours, time course of differentially expressed EMT markers and NK ligand genes during TGF-β–induced EMT, from a previously published gene expression profile data set (GEO GSE17708) (36). (B) Representative flow cytometric plot of cytotoxicity assay showing locations of effector, NK92mi (fluorophore-null cells), and target cells (fluorophore positive) and their exclusion DNA-binding dye status (viability indicator). PI, propidium iodide. (C–G) NK92mi-mediated cytotoxicity plots after 4 hours of coculture at indicated E/T ratios per cell type and treatment. Cell lines were treated with TGF-β (5 ng/ml) for 3, 6, 12, 6, and 6 days to induce optimum EMT, as assessed by complete E-cad downregulation and induction of vimentin or N-cadherin, in A549 (C), H460 (D), H358 (E), MCF7 (F), and DLD-1 (G), respectively. Data represent triplicate mean ± SEM, and 2-tailed unpaired t tests were performed. All experiments were repeated at least twice. (H) Freshly isolated human peripheral blood–derived NK cells were used as effector cells (E/T, 10:1) against A549 cells. K562 cells were used as a positive control for cytotoxicity. Data represent mean ± SEM, and 2-tailed, unpaired, t tests were performed. (I) To assess experimental metastasis, A549 cells were treated with TGF-β (5 ng/ml) in vitro and injected through the tail vein into RAG–/– mice. After 8 weeks, lungs were harvested to assess tumor burden. NRS, normal rabbit serum. Data represent 2 independent experiments, n = 3–4 for each group, and pooled results are shown. Error bars are SEM; Mann-Whitney U test was performed, *P < 0.05, **P < 0.01, ***P < 0.001, ****P < 0.0001.

