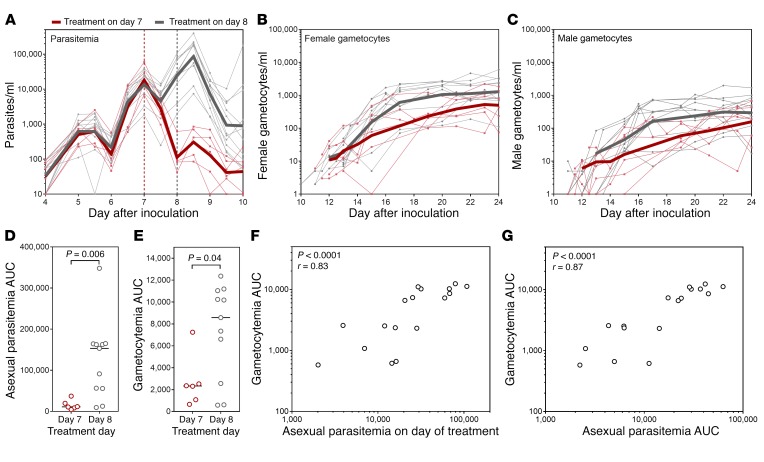
Figure 3. Development of parasitemia and gametocytemia.
Participants (n = 17) were experimentally infected with P. falciparum on day 0. (A) Parasite development as measured by 18S rDNA qPCR. Piperaquine (480 mg) was administered on day 7 pi for group 1 (n = 6; vertical red dashed line) or on day 8 pi for groups 2 and 3 (n = 11; vertical gray dashed line). Gametocyte development measured by qRT-PCR for (B) pfs25 (female gametocytes) and (C) pfMGET (male gametocytes). For A–C, the thin lines show individual participant curves and geometric means are in bold. (D) Asexual parasitemia AUC (days 0–10) and (E) gametocytemia AUC (days 10–21), grouped by treatment day (480 mg piperaquine) (compared by Kolmogorov-Smirnov test). Correlation of gametocytemia AUC (from day 10–21) with (F) asexual parasitemia on the day of treatment or (G) asexual parasitemia AUC (from day 0 to day of treatment) assessed using Spearman’s rank correlation.

