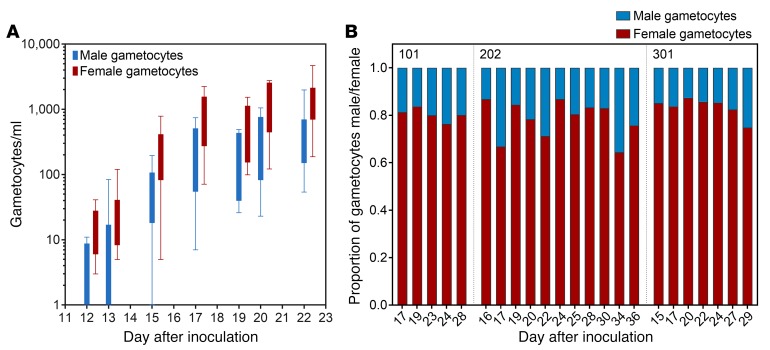
Figure 4. Male and female gametocyte sex ratios.
Gametocyte development was monitored by qRT-PCR for pfs25 (female gametocytes) and pfMGET (male gametocytes). (A) Comparison of male and female gametocyte densities over time, with box plots indicating the median and whiskers showing the minimum and maximum responses (only includes data at time points where values exist for > 50% of the participants). (B) Proportion of gametocytes that are either male or female over time for 3 participants.

