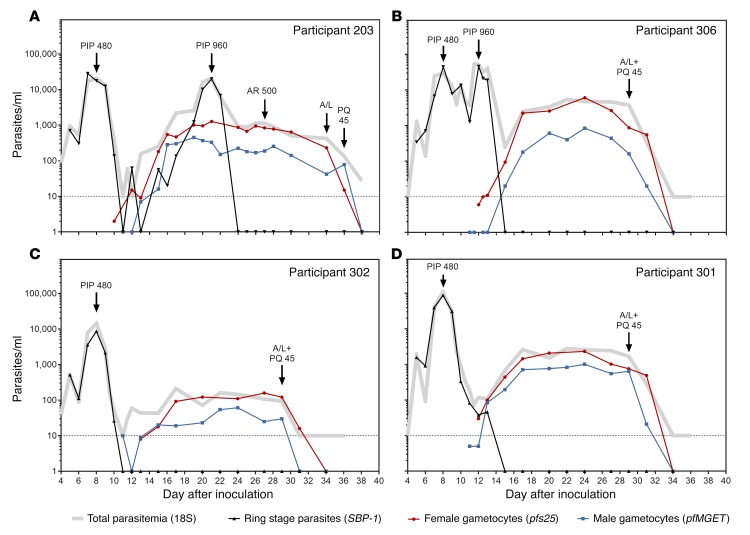
Figure 5. The course of asexual parasitemia and gametocytemia.
Representative graphs from groups 2 and 3 showing all data from qRT-PCR mRNA assays to illustrate the relationship between the parasite populations and the ability of SBP-1 mRNA to identify recrudescent infections. (A) Data from participant 203, (B) participant 306, (C) participant 302, and (D) participant 301 are shown. Male gametocytes (blue squares), female gametocytes (red circles), and ring-stage parasites (black triangles) are shown. Total parasitemia was also quantified by 18S rDNA qPCR (gray lines). Treatment administration is indicated with black arrows as follows: PIP 480, 480 mg piperaquine; PIP 960, 960 mg piperaquine; A/L, artemether/lumefantrine; PQ 45, 45 mg primaquine. Complete set of graphs for all participants is shown in Supplemental Figure 1, A–C.

