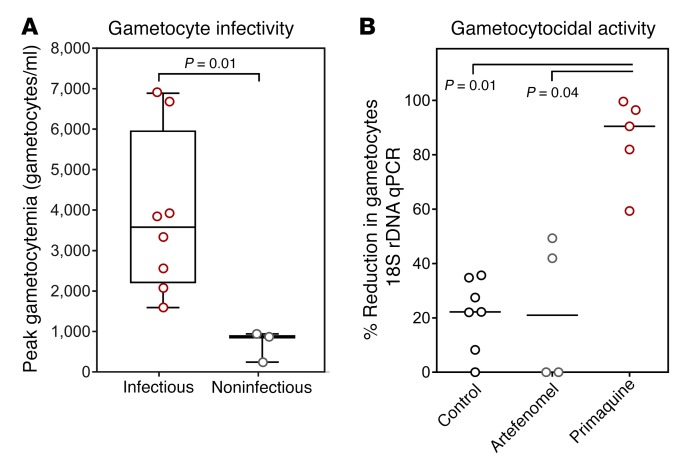
Figure 7. Gametocyte infectivity and clearance.
(A) The peak gametocytemia (male and female gametocytes) for participants who were noninfectious throughout the study compared with participants who were infectious on at least one occasion. Box plots indicate the median and whiskers show the minimum and maximum responses. Groups compared using Mann-Whitney U test. (B) Percentage reduction in gametocytemia (as measured by 18S rDNA qPCR in samples where ring-stage parasites were not present) between day of drug treatment and 5 days after treatment with 15 mg primaquine (n = 5), 500 mg artefenomel (n = 4), or no drug (negative control, n = 7). One participant from the negative control group is not represented due to the presence of ring-stage parasites precluding analysis of gametocyte clearance. Lines indicate the median response and groups compared by Kruskal-Wallis test with Dunn’s multiple comparison test comparing all groups.

