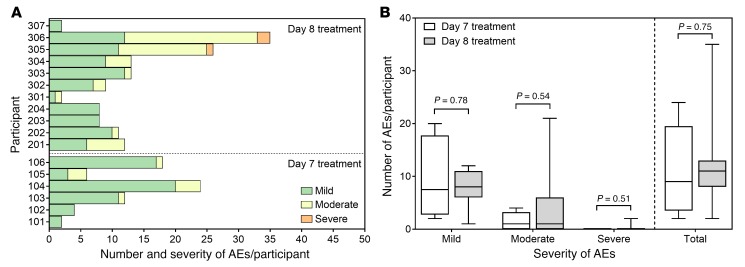
Figure 8. Safety of experimental malaria infection.
(A) Number and severity of AEs per participant with 480 mg piperaquine treatment on either day 7 pi (n = 6) or day 8 pi (n = 11). (B) Comparison of the number and severity of AEs by treatment day. Box plots indicate the median with whiskers showing the minimum and maximum responses. Groups compared using Mann-Whitney U test.

