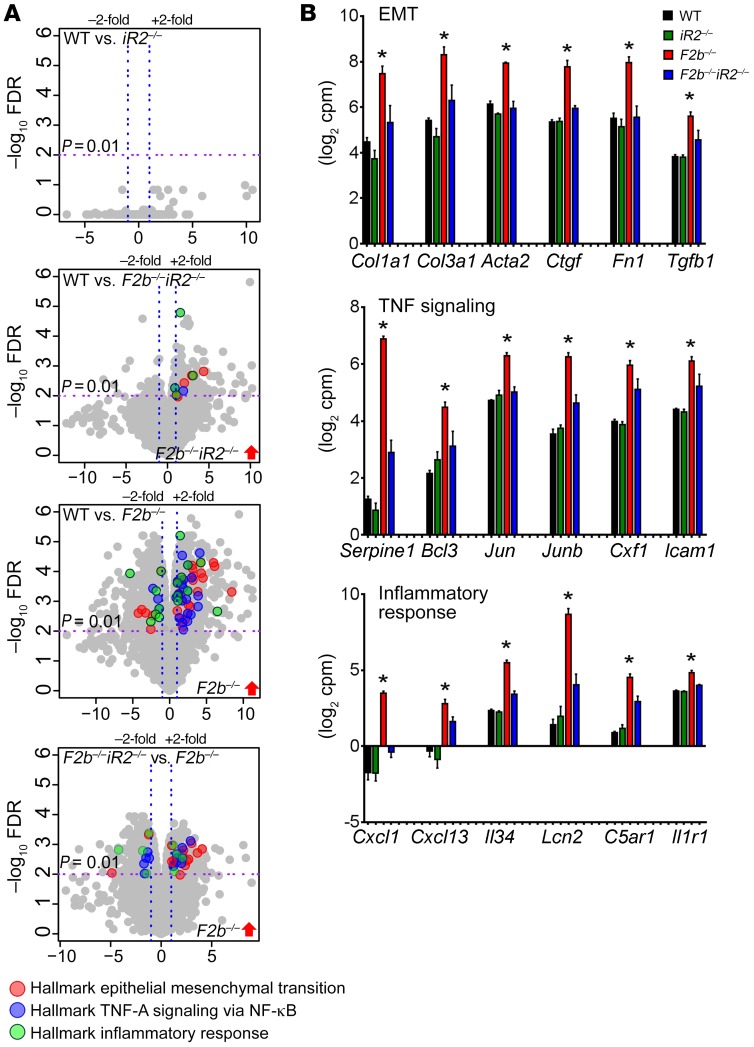
Figure 4. RNA-seq analysis of kidneys from Fcgr2b–/– mice.
(A) Volcano plots of genes differentially expressed between indicated mouse genotypes (P = 0.01, FC = 2). Differentially expressed genes that belong to the enriched hallmark gene sets identified by GSEA are shown in colors, as indicated. (B) Expression of representative genes in the hallmark gene sets. Data are shown as mean ± SEM. *P < 0.01. n = 4 mice per group. Serpine1, serpin peptidase inhibitor, clade E member 1; Bcl3, B cell CLL/lymphoma 3; Jun, jun oncogene; Junb, jun B proto-oncogene; Csf1, colony stimulating factor 1; Icam1, intercellular adhesion molecule 1; C5ar1, complement C5a receptor 1; Il1r1, interleukin 1 receptor type 1.

