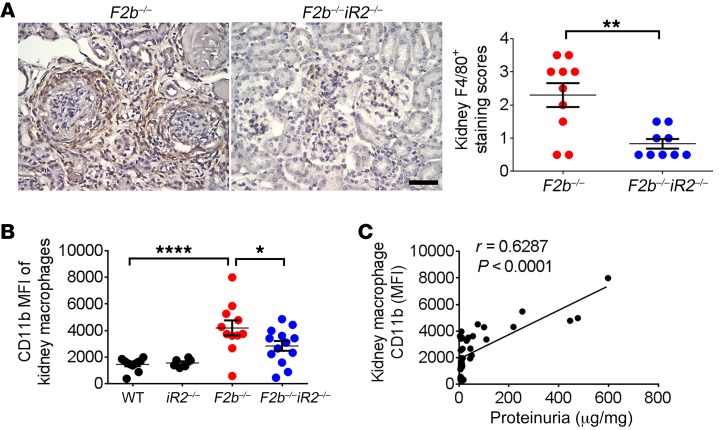
Figure 6. Activation of kidney macrophages was associated with renal injury in Fcgr2b–/– mice.
(A) Staining of F4/80+ macrophages in the kidneys of Fcgr2b–/– and Fcgr2b–/–Rhbdf2–/– mice by immunohistochemistry. Brown shows F4/80+. (n = 10 Fcgr2b–/–, n = 9 Fcgr2b–/–Rhbdf2–/– mice). Data are shown as mean ± SEM. Scale bar: 25 μm. **P < 0.01, 2-tailed Mann-Whitney U test. (B) Expression of CD11b in CD45+F4/80hiCD11b+ kidney macrophage population assessed by flow cytometry. n = 11 WT, n = 6 Rhbdf2–/–, n = 11 Fcgr2b–/–, n = 13 Fcgr2b–/–Rhbdf2–/– mice. Data are shown as mean ± SEM. *P < 0.05; ****P < 0.0001, 1-way ANOVA with Dunnett’s multiple comparisons test. (C) Correlation analysis of kidney macrophage CD11b levels and proteinuria. n = 11 WT, n = 6 Rhbdf2–/–, n = 11 Fcgr2b–/–, n = 13 Fcgr2b–/–Rhbdf2–/– mice, 41 mice in total. Spearman’s correlation, 2-tailed.

