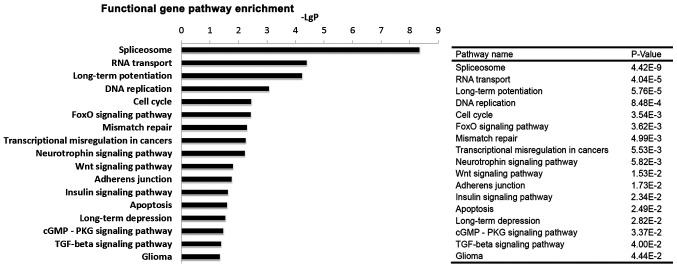
Figure 5.
Significantly changed pathways induced by BRD4 knockdown in U251 cells. The y-axis represents the significantly modulated pathways, and the x-axis represents the value of -LogP. A larger -LgP indicates a smaller P-value. The P-values of the enriched pathways are presented in the table at the right-hand side of the figure. BRD4, bromodomain containing 4.

