Figure 5.
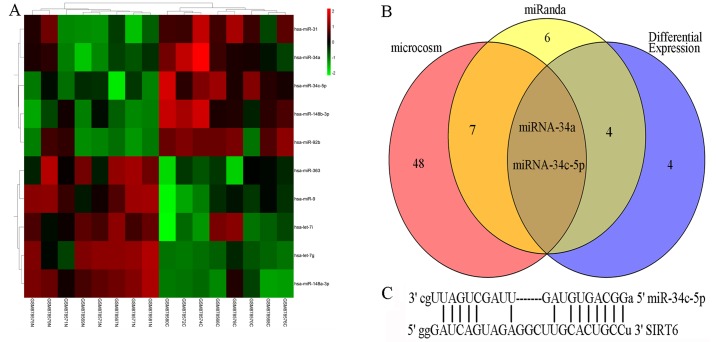
Bioinformatics analysis. (A) Cluster analysis of the differentially expressed miRNAs between colon cancer tissues ('C') and adjacent tissues ('N'). A total of 10 significant differentially expressed miRNAs (|log fold change|>1.5 and P<0.05) are highlighted in green (downregulated) and red (upregulated). (B) Overlap analysis of miRanda, MicroCosm and differentially expressed miRNAs. miR-34c-5p and miR-34a are most likely to interact with the 3′-untranslated region of SIRT6 mRNA. (C) Potential binding sites of miR-34c-5p and SIRT6 mRNA. miR, microRNA; SIRT6, sirtuin 6.

