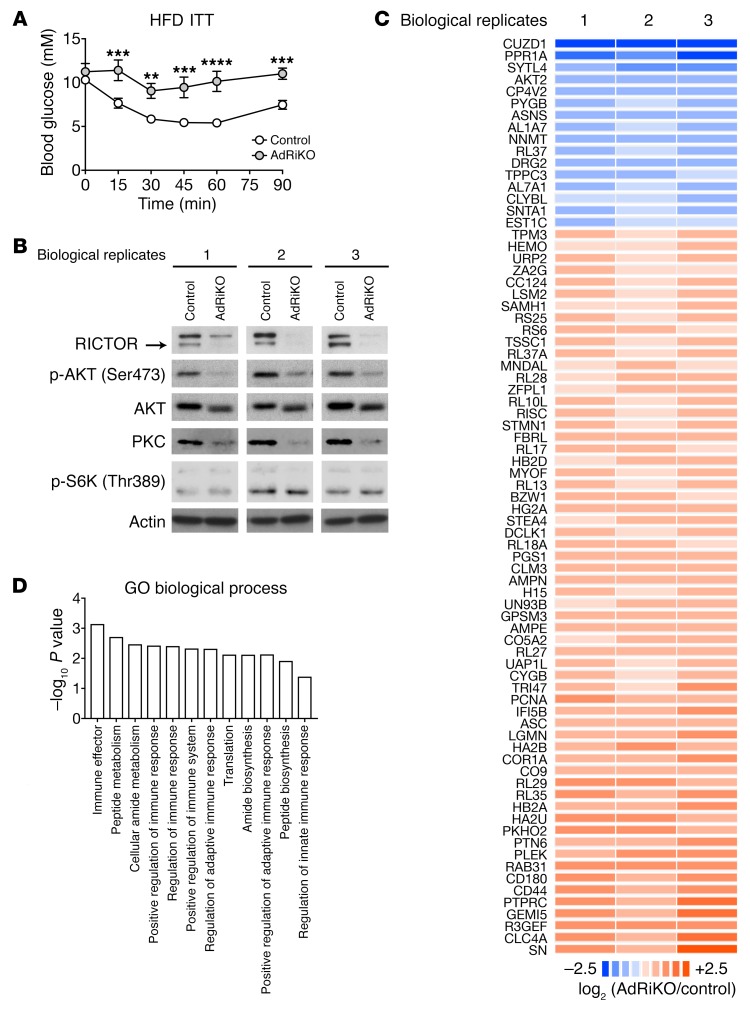
Figure 1. Quantitative proteome analysis reveals insulin/mTORC2 signaling functions in adipose tissue inflammation.
(A) ITT for AdRiKO and control mice fed a HFD for 10 weeks. Mice were fasted for 5 hours prior to the ITT. Data are presented as the mean ± SEM. **P < 0.01, ***P < 0.001, and ****P < 0.0001, by 2-way ANOVA. n = 10 (control) and n = 5 (AdRiKO). (B) Immunoblots of eWAT from HFD-fed AdRiKO and control mice. eWAT samples were collected from ad libitum–fed mice. The same lysates were used for proteome analysis. (C) Regulated proteome with 3 biological replicates. See also Supplemental Table 1. (D) GO term analysis of the regulated proteome. Data are presented as the mean ± SEM.

