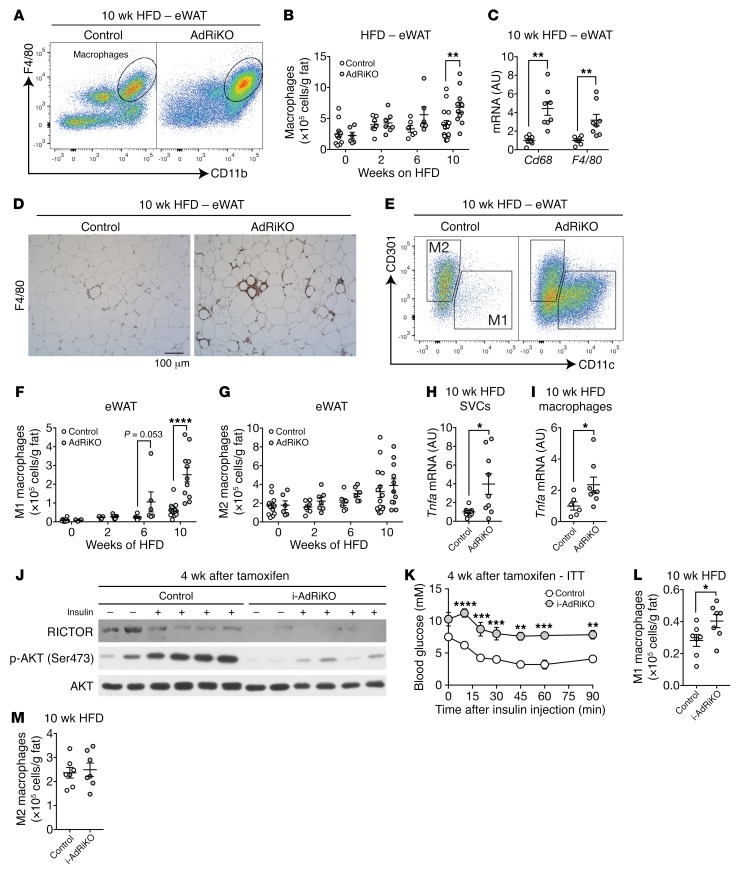
Figure 2. AdRiKO eWAT accumulates M1 macrophages.
(A and B) Numbers of macrophages (CD45+F4/80+CD11b+) in SVCs isolated from eWAT of HFD-fed AdRiKO and control mice. Representative FACS profiles are shown in A, and quantification is shown in B. **P < 0.01, by multiple Student’s t test. n = 6–15. (C) Gene expression of macrophage markers in eWAT from HFD-fed AdRiKO and control mice. **P < 0.01, by multiple Student’s t test. n = 7–8. (D) Representative F4/80 staining of eWAT from HFD-fed AdRiKO and control mice. n = 4. Scale bar: 100 μm. (E–G) Numbers of M1 macrophages (CD45+F4/80+CD11b+CD11c+) and M2 macrophages (CD45+F4/80+CD11b+CD301+) in SVCs from eWAT of HFD-fed AdRiKO and control mice. Representative FACS profiles are shown in E, and quantification is shown in F and G. ****P < 0.0001 and P = 0.053, by multiple Student’s t test. n = 6–15. (H and I) Tnfa gene expression in SVCs (H) (n = 9) and isolated macrophages (I) (n = 6–8) from eWAT of HFD-fed AdRiKO and control mice. *P < 0.05, by unpaired Student’s t test. (J) Immunoblots of eWAT from i-AdRiKO and control mice. Mice were treated with tamoxifen for 5 days. After 4 weeks, mice were fasted for 5 hours and then treated with PBS or insulin. (K) ITT for i-AdRiKO and control mice 4 weeks after induction of Rictor knockout. Mice were fasted for 5 hours prior to the ITT. **P < 0.01, ***P < 0.001, and ****P < 0.0001, by 2-way ANOVA. n = 5 (control) and n = 6 (i-AdRiKO). (L and M) Numbers of M1 macrophages (CD45+F4/80+CD11b+CD11c+) (L) and M2 macrophages (CD45+F4/80+CD11b+CD301+) (M) in SVCs from eWAT of HFD-fed i-AdRiKO and control mice. *P < 0.05, by unpaired Student’s t test. n = 7. Data are presented as the mean ± SEM.

