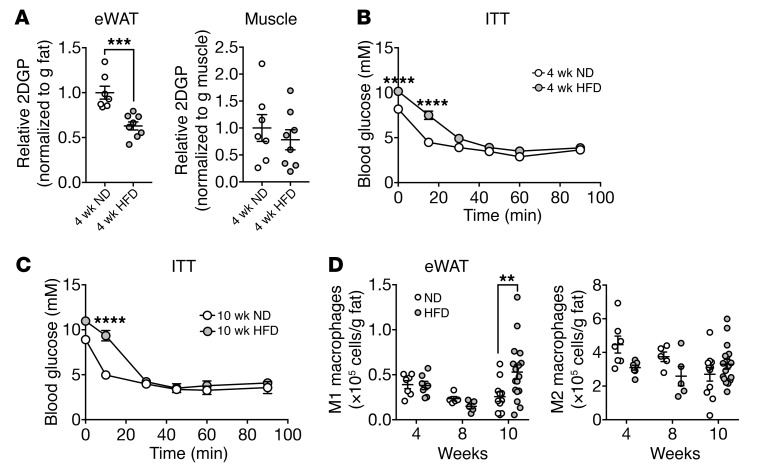
Figure 3. HFD-induced insulin resistance precedes the accumulation of M1 macrophages.
(A) Insulin-stimulated 2DGP accumulation in eWAT and muscle from WT mice fed a ND or HFD for 4 weeks. Mice were fasted for 5 hours, injected with insulin at 0 minutes and 2DG at 10 minutes, and sacrificed at 30 minutes. ***P < 0.001, by unpaired Student’s t test. n = 7–8. (B and C) ITT for WT mice fed a ND or HFD for 4 weeks (B) or 10 weeks (C). Mice were fasted for 5 hours prior to the ITT. ****P < 0.0001, by 2-way ANOVA. n = 15 (4 wk ND), n = 17 (4 wk HFD), n = 3 (10 wk ND), and n = 4 (10 wk HFD). (D) Numbers of M1 macrophages (CD45+F4/80+CD11b+CD11c+) and M2 macrophages (CD45+F4/80+CD11b+CD301+) in eWAT of WT mice fed a HFD for 4, 8, or 10 weeks. **P < 0.01, by multiple Student’s t test. n = 5–17. Rictorfl/fl mice were used as WT controls. Data are presented as the mean ± SEM.

