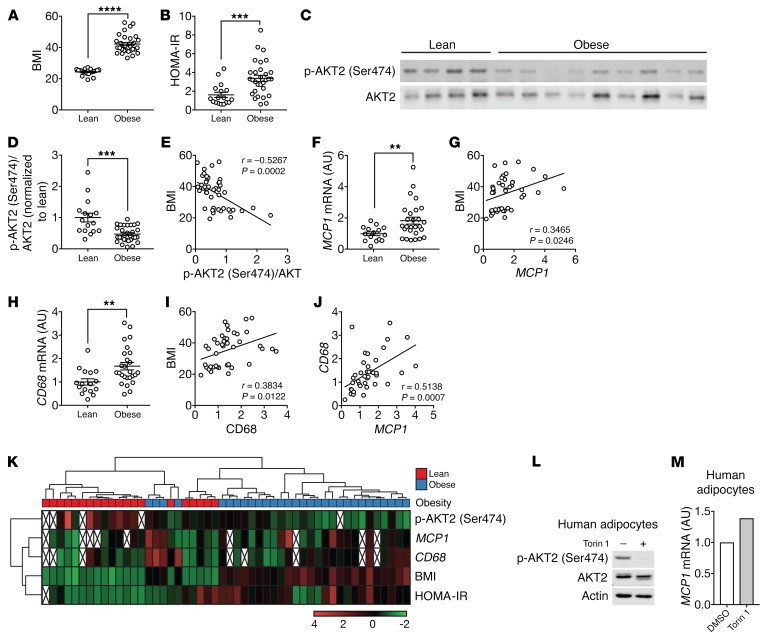
Figure 6. Impaired insulin/mTORC2 signaling and increased MCP1 expression in oWAT of insulin-resistant obese patients.
(A and B) BMI and HOMA-IR of lean and obese patients. ***P < 0.001 and ****P < 0.0001, by Mann-Whitney U test. See also Supplemental Table 2. (C) Representative immunoblots for p-AKT2 (Ser474) and AKT2 in human oWAT. (D) Quantification of p-AKT2 (Ser474) normalized to total AKT2. ***P < 0.001, by Mann-Whitney U test. (E) p-AKT2 (Ser474)/AKT2 negatively correlated with BMI. Significance was determined by Pearson’s correlation analysis. (F) MCP1 mRNA levels in human oWAT. **P < 0.01, by Mann-Whitney U test. (G) MCP1 positively correlated with BMI. Significance was determined by Pearson’s correlation analysis. (H) CD68 mRNA levels in human oWAT. **P < 0.01, by Mann-Whitney U test. (I and J) CD68 positively correlated with BMI (I) and MCP1 levels (J). Significance in I and J was determined by Pearson’s correlation analysis. (K) Cluster analysis of BMI, HOMA-IR, p-AKT2 (Ser474)/AKT2, MCP1, and CD68 levels. (L and M) Effect of torin 1 on insulin/mTORC2 signaling (L) and MCP1 mRNA levels (M) in human primary adipocytes. Differentiated human primary adipocytes were treated with DMSO or 250 nM torin 1 for 6 hours.

