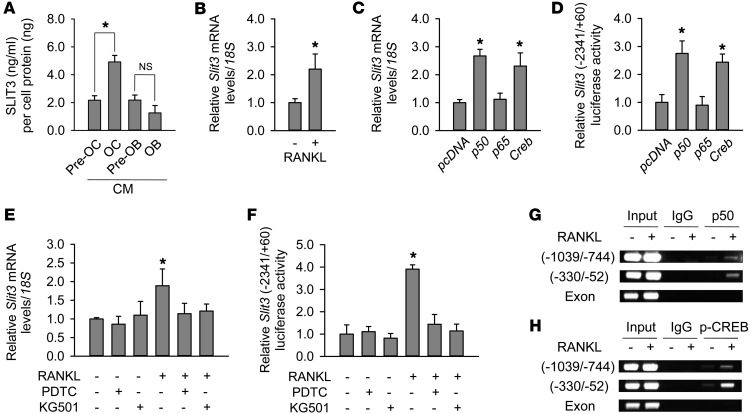
Figure 1. Increased SLIT3 production during osteoclast differentiation.
(A) SLIT3 concentrations measured by ELISA in the CM from lineages of osteoclasts (OCs) and osteoblasts (OBs). The levels were normalized by the protein amount of each cell lysate. (B) Quantitative RT-PCR to measure Slit3 levels in RAW264.7 cells. Cells were treated with RANKL (15 ng/ml) for 4 days to induce osteoclast-like cells. Quantitative gene expression analysis was performed by RT-PCR using the LightCycler 480 system. 18S rRNA was used as an internal control. Ratios of Slit3 and 18S rRNA expression levels were calculated using the 2–ΔΔCT method. (C and D) Quantitative RT-PCR and luciferase assays of Slit3 expression and Slit3 promoter activity, respectively, after transfection with 50 ng cDNAs expressing Creb or NF-κB subunits p50 or p65 for 48 hours, in RAW264.7 cells. The values were normalized to the 18S rRNA level and β-galactosidase activity, respectively. (E and F) Quantitative RT-PCR and luciferase assays before and after pretreatment with inhibitors of NF-κB p50 and CREB (PDTC and KG501, respectively) in BMMs with M-CSF. (G and H) ChIP assay after IP with antibodies against NF-κB p50 and phosphorylated CREB in RAW264.7 cells to assess the activation of these factors at Slit3 promoter regions. RANKL (100 ng/ml) treatment duration was 1 hour. Data are presented as mean ± SEM of 3–4 independent experiments. *P < 0.05 vs. untreated or empty vector–transfected control using the Mann-Whitney U test or Kruskal-Wallis test followed by Bonferroni’s correction.

