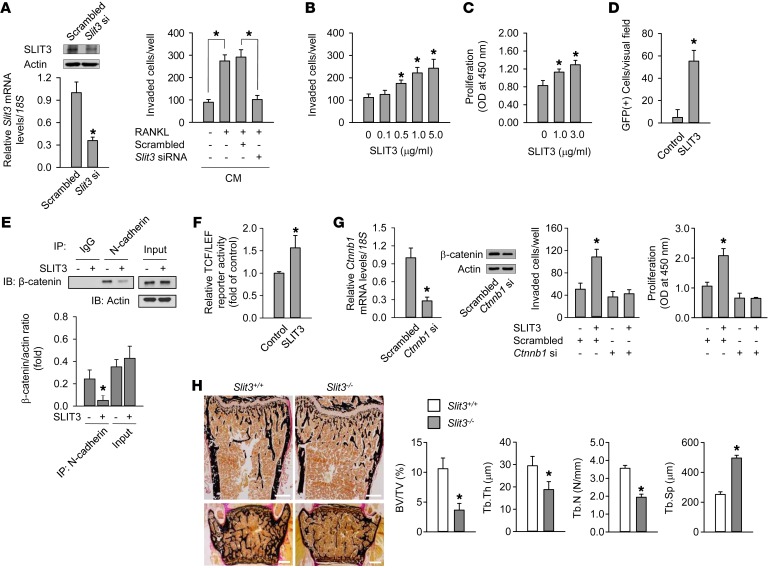
Figure 2. SLIT3 stimulates osteoblast migration and proliferation.
(A) Quantitative RT-PCR and Western blot of SLIT3 after transfection with Slit3 siRNA for 24 hours in mouse mature osteoclasts. Mouse BMMs were differentiated into mature osteoclasts with 15 ng/ml RANKL and 15 ng/ml M-CSF for 3 days, and CM were collected during the subsequent 24 hours with or without Slit3 siRNA. Directional migration of MC3T3-E1 cells was assessed after treatment with the collected CM for 24 hours. (B and C) Directional migration (B) and proliferation (C) of mouse calvaria osteoblasts with SLIT3 for 24 hours and 48 hours, respectively. (D) Intrabone marrow mobilization of GFP-labeled MC3T3-E1 cells (n = 5 per group). (E) Western blot of β-catenin after IP with N-cadherin in mouse calvaria osteoblasts with 1.0 μg/ml SLIT3 for 60 minutes. The experiment was performed without WNTs. (F) TCF/LEF reporter assay with 1.0 μg/ml SLIT3 for 48 hours in MC3T3-E1 cells. (G) Quantitative RT-PCR and Western blot of β-catenin after transfection with β-catenin siRNA (Ctnnb1) for 24 hours in mouse calvaria osteoblasts. Directional migration and proliferation were assessed after treatment with 1.0 μg/ml SLIT3 for 24 hours and 48 hours, respectively. (H) Von Kossa staining of femur (upper) and lumbar spine (lower) of 7-week-old male Slit3–/– mice and WT littermates (n = 4–5 per group). Trabecular bone parameters in the femur were assessed by histomorphometric analyses. BV/TV, bone volume/tissue volume; Tb.Th, trabecular thickness; Tb.N, trabecular number; Tb.Sp, trabecular separation. Scale bars: 500 μm. Detailed information appears in the Supplemental Methods. Data are presented as mean ± SEM. In vitro experiments were performed 3–5 times independently. *P < 0.05 vs. untreated control or WT mice using the Mann-Whitney U test or Kruskal-Wallis test followed by Bonferroni’s correction.

