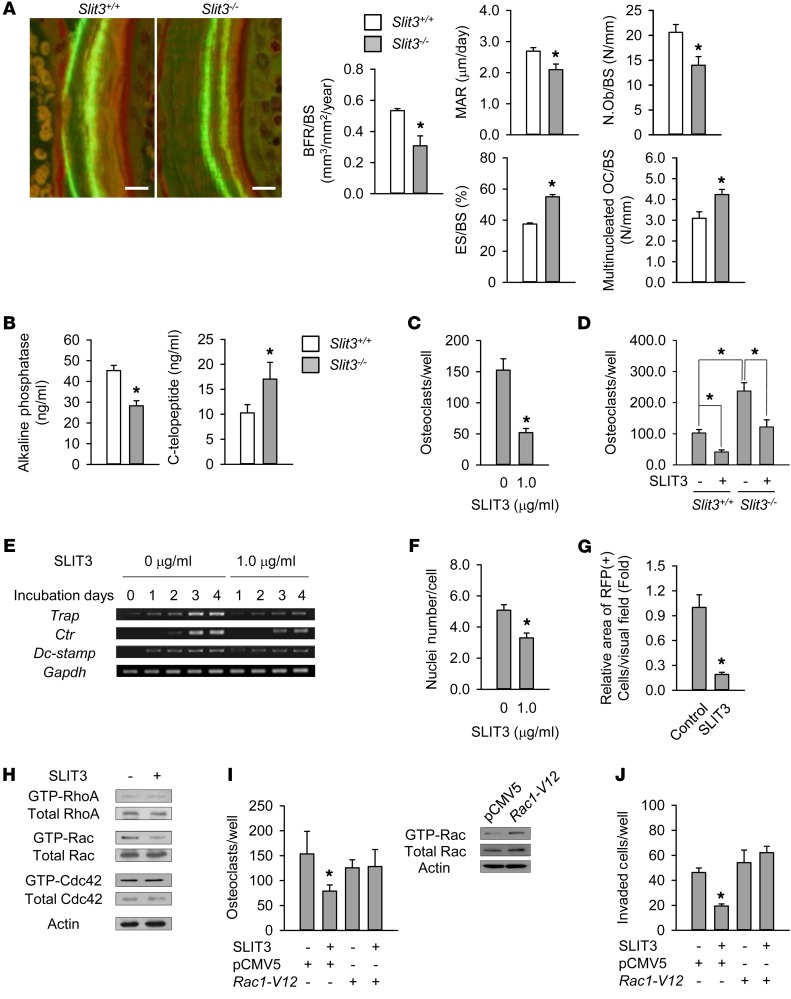
Figure 3. Regulation of bone resorption by SLIT3.
(A) Histomorphometric analyses including calcein double labeling of the femur of 7-week-old male Slit3–/– mice and WT littermates (n = 4–5 per group). BFR/BS, bone formation rate per bone surface; MAR, mineral apposition rate; N.Ob/BS, osteoblast number/bone surface; ES/BS, eroded surface/bone surface; OC/BS, multinucleated osteoclast number/bone surface. Scale bars: 10 μm. (B) Serum bone turnover markers in 7-week-old male Slit3–/– mice and WT littermates (n = 9–10 per group). (C) TRAP staining of mouse BMMs with 15 ng/ml M-CSF and 15 ng/ml RANKL for 4 days. (D) The same methods were performed in BMMs obtained from 6-week-old male or female Slit3–/– mice and WT littermates (n = 3 per group). (E) Semiquantitative RT-PCR of Trap, Ctr, and Dc-stamp in mouse BMMs with M-CSF and RANKL. (F) TRAP staining of mouse BMMs with M-CSF and RANKL for 2–3 days. The nuclei number per TRAP-positive cell was counted. (G) Intrabone marrow mobilization of red fluorescent protein–labeled (RFP-labeled) BMMs (n = 5 per group). (H) Western blot of RhoA, Rac, and Cdc42 following 1.0 μg/ml SLIT3 treatment for 15 minutes in mouse BMMs with M-CSF and RANKL. (I) Western blot of Rac GTPase after transfection with empty vector (pCMV5) or mutationally activated Rac1 (Rac1-V12) in mouse BMMs. TRAP staining was also performed at 4 days after transfection. (J) Directional migration of mouse BMMs with 1.0 μg/ml SLIT3 for 24 hours after transfection. Detailed information is supplied in the Supplemental Methods. Data are presented as mean ± SEM. In vitro experiments were performed 3–4 times independently. *P < 0.05 vs. untreated or empty vector–transfected control or between indicated groups using the Mann-Whitney U test or Kruskal-Wallis test followed by Bonferroni’s correction.

