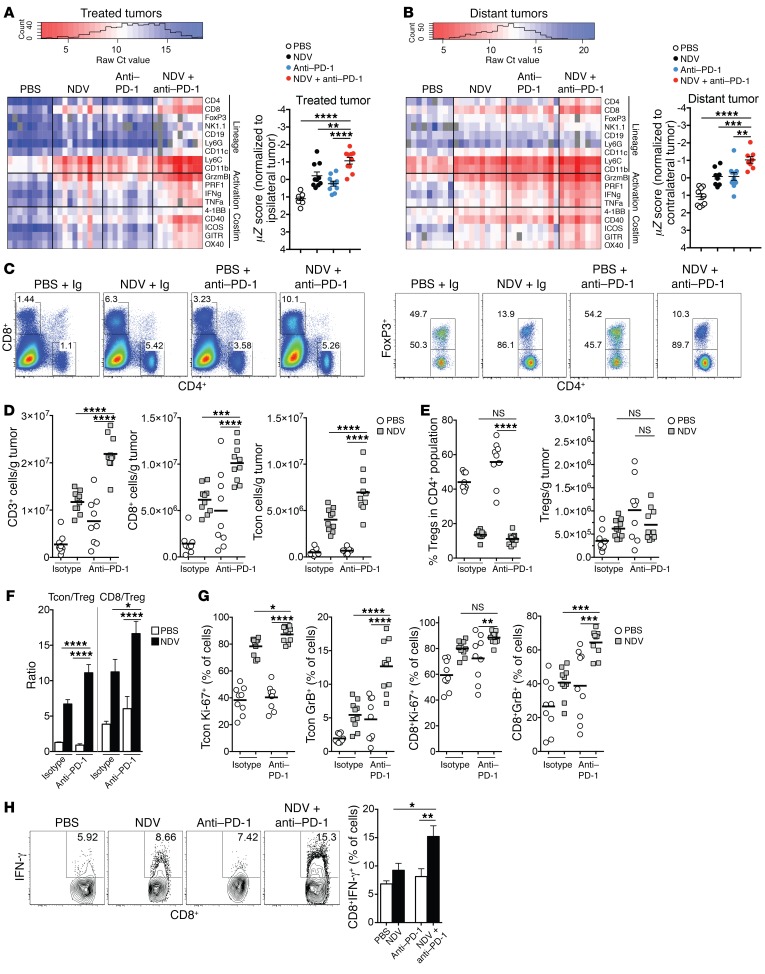
Figure 7. Potentiation of immune effects of NDV by PD-1 blockade.
Animals bearing bilateral flank B16-F10 melanoma tumors were treated according to the schedule in Figure 6. (A and B) Gene expression analyses from treated (A) and distant (B) tumors, focusing on selected lineage-defining and T cell activation and costimulation markers. Costimulation (Costim) and activation markers were used to calculate an activation signature Z score. (C) Representative plots of percentages of CD4+ and CD8+ lymphocytes from distant tumors (gated on total live cells). (D) Absolute numbers of CD3+, CD8+, and CD4+FoxP3– (Tcon) lymphocytes in distant tumors. (E) Relative percentages and absolute numbers of Tregs in distant tumors. (F) Tcon/Treg and CD8+/Treg ratios in distant tumors. (G) Expression of proliferation and lytic markers by tumor-infiltrating CD8 and Tcon cells in distant tumors. (H) IFN-γ release by distant tumor–infiltrating CD8+ lymphocytes in response to stimulation with tumor antigen-loaded DCs. Data represent 1 of 2 experiments with 10 mice per group and indicate the mean ± SEM. Data were analyzed by 1-way ANOVA with multiple comparisons. *P < 0.05, **P < 0.01, ***P < 0.001, and ****P < 0.0001.

