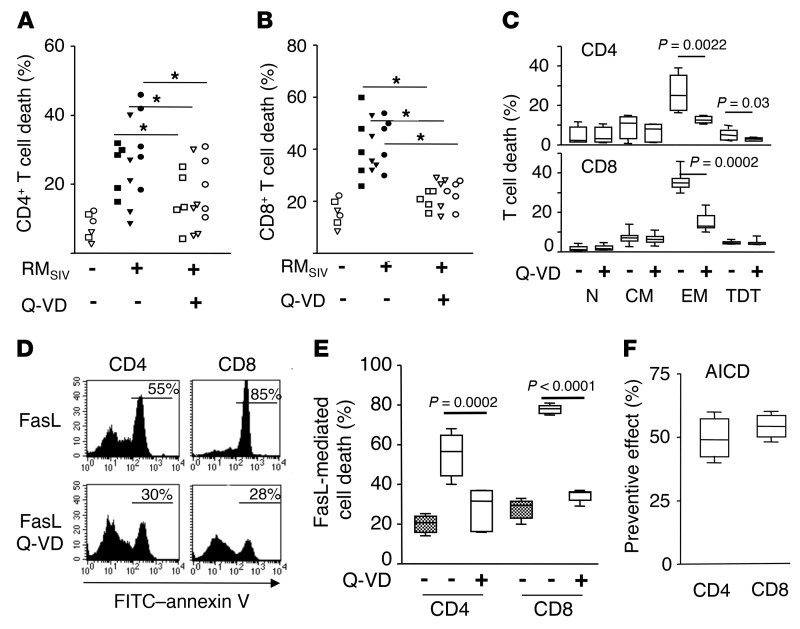
Figure 1. Q-VD-OPH prevents ex vivo cell death and enhances proliferation of T cells from SIV-infected RMs.
Percentage of dying (A) CD3+CD4+ and (B) CD3+CD8+ T cells from axillary (squares) and inguinal (triangles) LNs and from the spleen (circles) of either healthy RMs (RMSIV, –; n = 2) or chronically SIV-infected RMs (RMSIV, +; n = 5) in the absence (–, filled symbols) or presence of Q-VD-OPH (Q-VD) (+, open symbols). Animals were sacrificed 6 months after infection. Statistical significance was assessed using Wilcoxon’s matched-pairs signed rank test (1-tailed P < 0.05). (C) Percentage of dying CD3+CD4+ and CD3+CD8+ T subsets (naive [N], CD45RA+CD62L+; Tcm [CM], CD45RA–CD62L+; Tem [EM], CD45RA–CD62L–; terminally differentiated T [TDT] cells, CD45RA+CD62L–) from peripheral blood of SIV-infected RMs (n = 6) in the absence (–) or presence (+) of Q-VD-OPH. (D) Representative flow cytometric analysis of phosphatidylserine residue exposure (annexin V staining) on CD3+CD4+ and CD3+CD8+ T cells from peripheral blood of a chronically SIV-infected RM incubated overnight in the presence of FasL. (E) Histogram of CD3+CD4+0 and CD3+CD8+ T cells from either healthy (gray boxes, n = 6) or SIV-infected RMs (white boxes, n = 8) incubated with FasL in the absence (–) or presence (+) of Q-VD-OPH. (F) PBMCs from SIV-infected RMs (n = 6) were stimulated with ConA in the absence or presence of Q-VD-OPH. AICD was assessed after overnight culture by flow cytometry using annexin V. Histogram represents the preventive effect calculated as 100 x ((cells untreated – cells+Q-VD)/cells untreated). Statistical significance was assessed using paired Student’s t test. Prism was used to present the results in box-and-whisker plots showing the minimum and maximum of all the data. P < 0.05.

