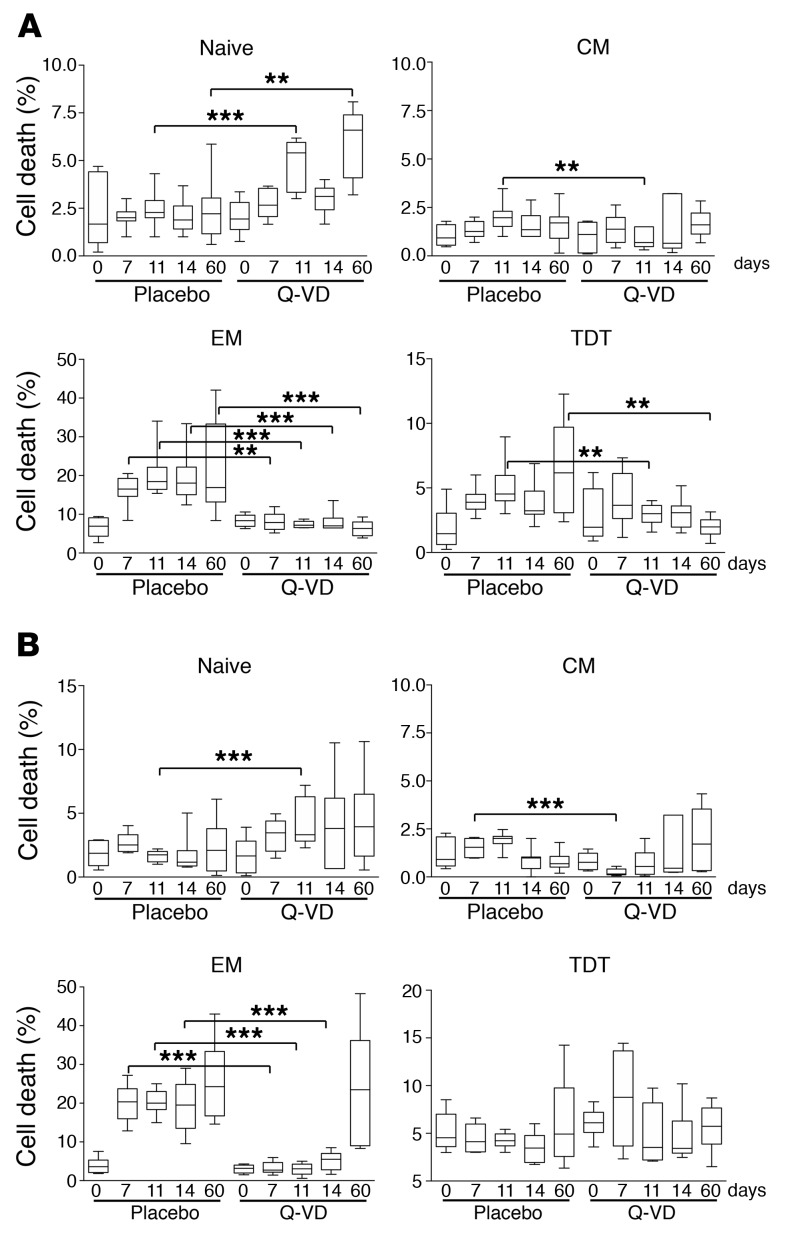
Figure 5. Q-VD-OPH treatment reduces memory T cell death in SIV-infected RMs.
Dying CD4+ (A) and CD8+ (B) T cell subsets (naive, CD45RA+CD62L+; Tcm, CD45RA–CD62L+; Tem, CD45RA–CD62L–; TDT, CD45RA+CD62L–) of either untreated (placebo, n = 12) or Q-VD-OPH–treated RMs (Q-VD, n = 6) were quantified after overnight culture by flow cytometry using annexin V (spontaneous T cell death). Statistical differences were assessed using the Mann-Whitney U test (*0.01 < P < 0.05; **0.001 < P < 0.01; ***P < 0.001). Prism was used to present the results in box-and-whisker plots showing the minimum and maximum of all the data.

