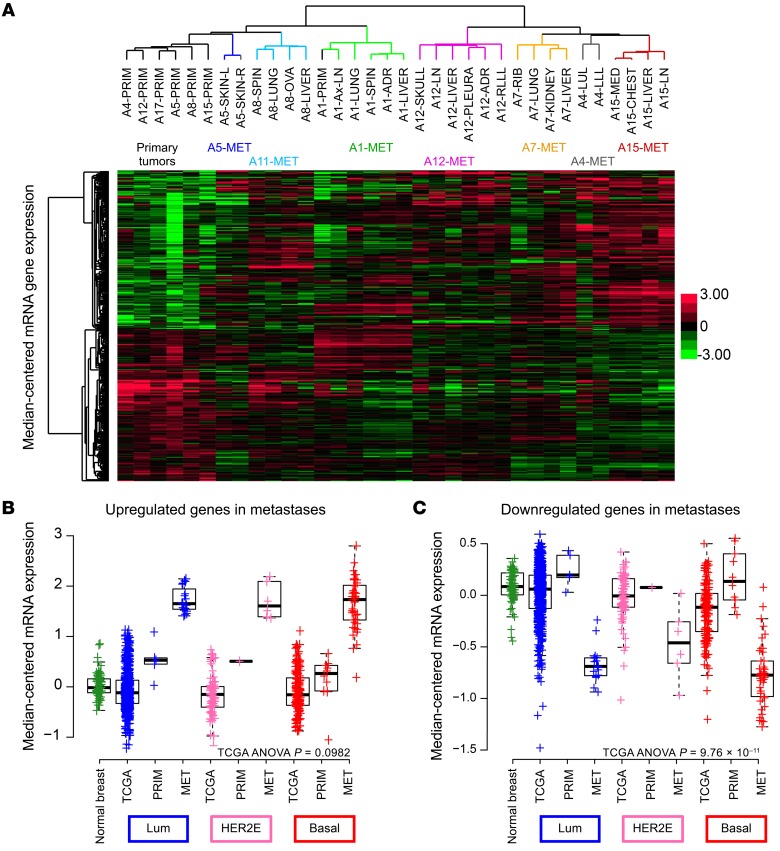
Figure 4. Differential gene expression in metastases.
(A) Hierarchical clustering of median-centered RNA gene expression defined as significantly differentially expressed genes in metastases (Mets) as compared with matched primary tumors (Primaries) with the lmer function in R. Each color in the dendrogram identifies a different patient. Box plots of the mean signature score of (B) upregulated genes and (C) downregulated genes, comparing the following categories: TCGA normal breast tissue, TCGA luminal A/B primary tumors, UNC RAP luminal primary tumors, UNC RAP luminal metastases, TCGA HER2-enriched primary tumors, UNC RAP HER2-enriched primary tumors, UNC RAP HER2-enriched metastases, TCGA basal-like primary tumors, UNC RAP basal-like primary tumors, and UNC RAP basal-like metastases. ADR, adrenal gland; Ax-LN, axillary lymph node; Basal, basal-like; HER2E, HER2-enriched; Lum, luminal; LLL, left lower lobe; LUL, left upper lobe; MED, mediastinum MET, metastases; OVA, ovary; PRIM, primary tumor; RLL, right lower lobe; SKIN-L, left skin; SKIN-R, right skin ; SPIN, spinal.

