. 2018 Mar 27;7:e33399. doi: 10.7554/eLife.33399

Figure 4. Reconstruction of ancestral state of NAP components in plant evolution.

Phylogeny of taxonomic classes are shown in left. Time point of the lineage diversification was calculated using TimeTree database (Kumar et al., 2017). Black stars indicate whole genome duplication events (Jiao et al., 2011). Right: phylogenetic trees show the copy number and phylogenetic relationship of each protein family in the common ancestors. Each circle is colored according to protein type as indicated in the box. In the top row, numbers indicate which genes of Arabidopsis thaliana belong to each subfamily and red circles indicates missing subfamilies in A. thaliana. Note that only branches with strong bootstrap support are shown.

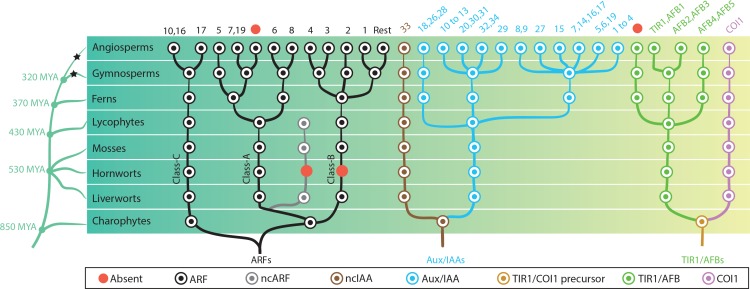
Figure 4.

Figure 4—figure supplement 1. Phylogenetic tree of Aux/IAA.

Figure 4—figure supplement 1.

Label color shows the taxonomic group of each protein as indicated in top. Colored boxes connected with gray bar shows the domain structure of each protein. Magenta: domain I, yellow domain II, blue: PB1. Numbers along with the branches indicate branch length. Orange circles indicate bootstrap values higher than 75. The complete tree can be found at http://itol.embl.de/shared/dolfweijers (interactive Tree of Life; iTOL).
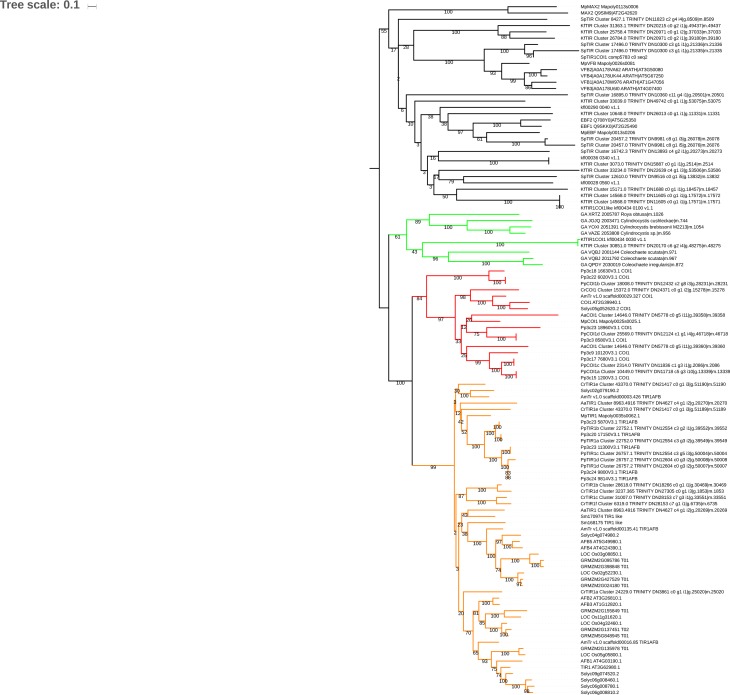
Figure 4—figure supplement 2. Phylogenetic tree of the proteins containing F-box and LRR.

Figure 4—figure supplement 2.

Colored branches indicate protein families. Green: TIR1/COI1 precursor of Charophytes, red: COI1, orange: TIR1/AFB, black: the others. Numbers along with the branches indicate bootstrap values. The complete tree can be found at http://itol.embl.de/shared/dolfweijers (interactive Tree of Life; iTOL).
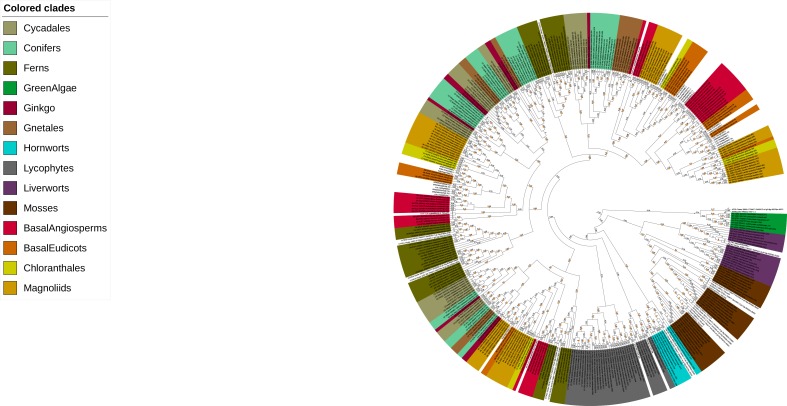
Figure 4—figure supplement 3. Phylogenetic tree of TIR1/AFB.

Figure 4—figure supplement 3.

Label color shows the taxonomic group of each protein as indicated in left. Numbers along with the branches indicate branch length. Orange circles indicate bootstrap values higher than 75.