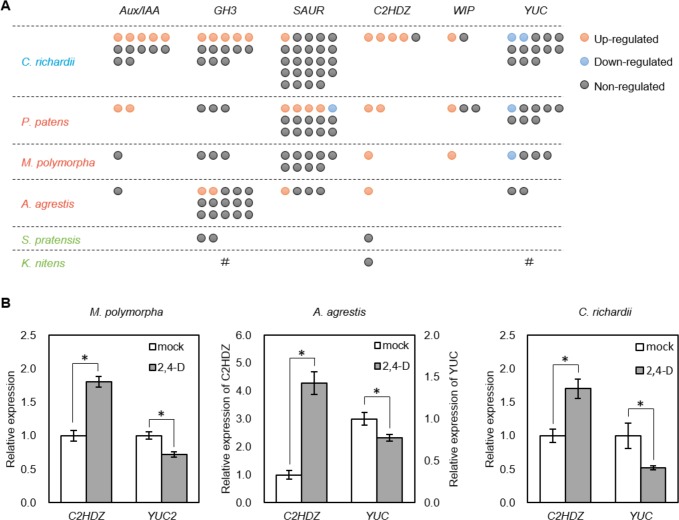
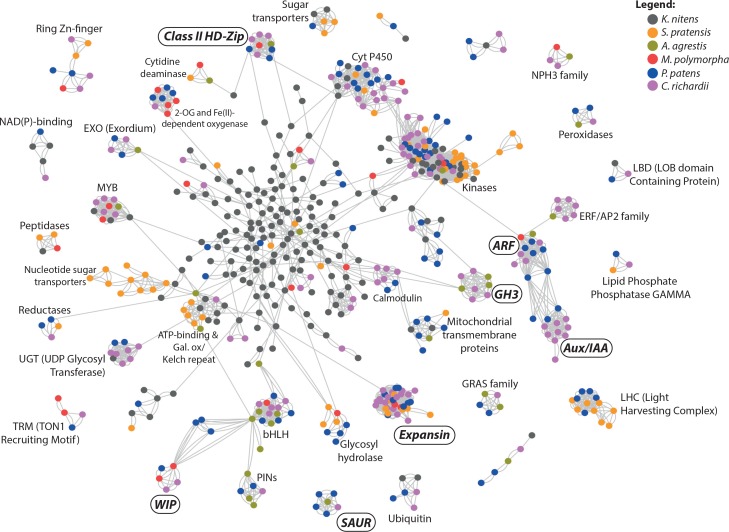
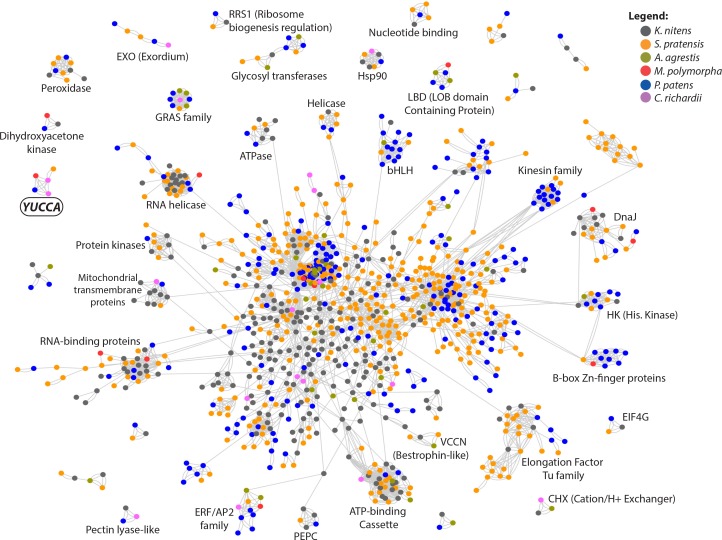
Figure 6. Identification of deeply conserved auxin-responsive genes.
(A) Auxin-dependence of six well-known angiosperm auxin-responsive gene families (top) surveyed from de novo assembly-based transcriptomes in six species. Each circle indicates a gene copy of each gene family. Red, blue and grey circle indicate up-, down- and non-regulated genes in response to auxin. #: no homologues were identified in our transcriptome possibly due to low expression, or they might be lost during evolution. (B) qPCR analysis of conserved auxin-responsive genes. Auxin treatment was performed in the same condition with RNA-seq experiment (10 μM 2,4-D for 1 hr). Relative expression values are normalized by the expression of EF1α in Marchantia polymorpha or the amount of total RNA in Anthoceros agrestis and Ceratopteris richardii. Each bar indicates average of expression with SD (biological replicates ≥3). *: p<0.01 (t-test).


