. 2018 Mar 27;7:e33399. doi: 10.7554/eLife.33399

Figure 7. Genetic analysis of ancient components in Marchantia polymorpha.

(A) Diagrams of gene structure and CRISPR/Cas9-mediated mutation in ncIAA, ncARF and ARF3 loci. Arrowheads indicate sgRNAs target sites. Gray and black boxes indicate UTR and CDS, respectively. Red and blue bars indicate the region coding PB1 and DBD. (B) 10-day-old gemmalings grown without or with 3 μM 2,4-D. Scale bars: 5 mm. (C) Expression analysis of auxin-responsive genes in WT, nciaa, ncarf, and arf3 mutants by qPCR. 10-day-old gemmalings (nciaa and ncarf) or regenerating thalli (arf1 and arf3) were treated with 10 μM 2,4-D for 1 hr. Each bar indicates average ±SD (biological replicates = 3). Asterisks indicate significant differences. *: p<0.01 (Tukey test), **: p<0.05 (t-test). (D, E) Thallus tips grown for 2 weeks (D) and gemma cups (E) of WT and arf3ge1-1 mutant. arf3ge1-1 showed growth retardation and no mature gemmae, similar to the other alleles. (F) Expression analysis of proARF3:ARF3-Citrine in arf3ge2-1 background. Left and right panel show developing and mature gemmae, respectively. Scale bars: 5 mm in (B and D), 0.5 mm in (E), 50 μm in (F).

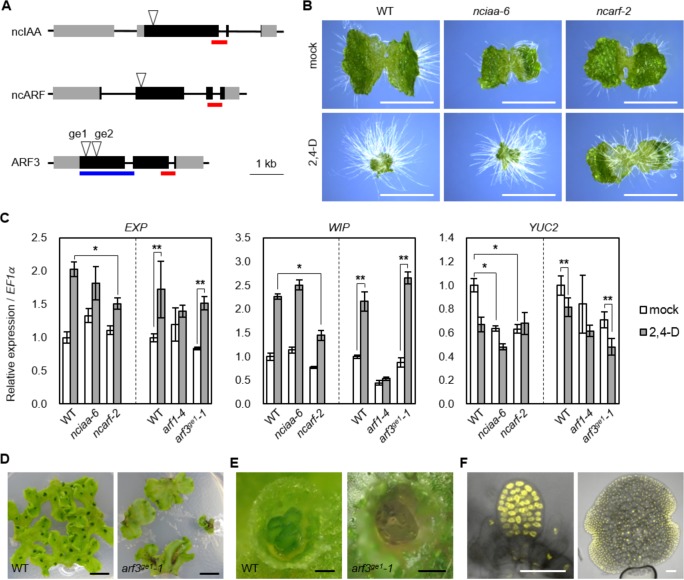
Figure 7.

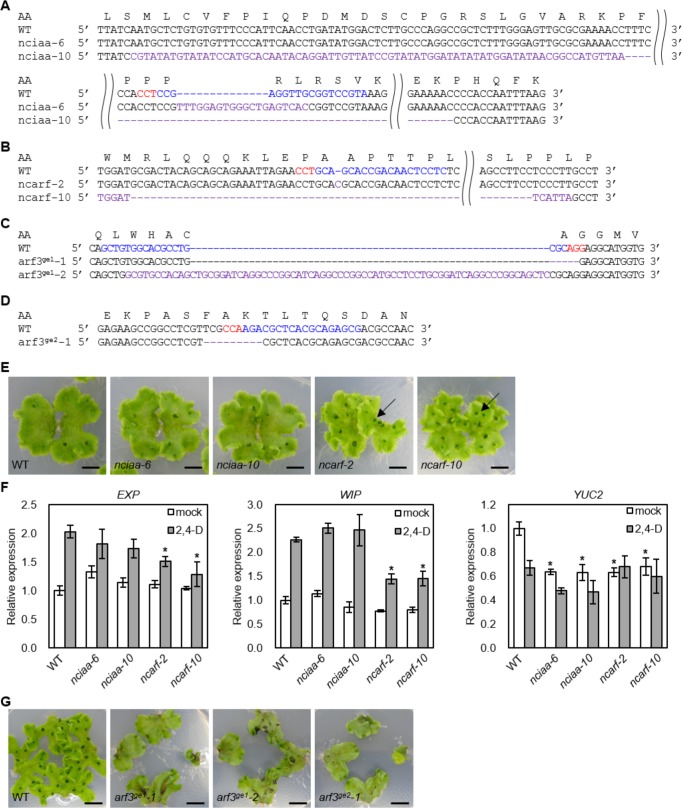
Figure 7—figure supplement 1. CRISPR/Cas9-mediated mutagenesis in M.

Figure 7—figure supplement 1.

polymorpha. (A–D) Mutations detected by sequencing analysis. The amino acid (AA) sequences encoded in WT are shown at the top. WT sequence is shown with the PAM sequence highlighted in red and the target sequence of sgRNA in blue. Purple bases indicate mutation. nciaa-6: 6 bp deletion and 20 bp insertion, nciaa-10: 776 bp deletion and 75 bp insertion, ncarf-2: 1 bp insertion, ncarf-10: 486 bp deletion and 6 bp insertion, arf3ge1-1: 5 bp deletion, arf3ge1-2: 11 bp deletion and 72 bp insertion, arf3ge2-1: 9 bp deletion. (E) Three-week-old gemmalings. Arrows indicate the thalli formed with up-side-down. (F) qPCR analysis on 10-day-old gemmalings with or without 10 μM 2,4-D treatment for 1 hr. Relative expression values are normalized by the expression of EF1α. Each bar indicates average with SD (biological replicate = 3). Each asterisk indicates significant difference between WT and mutants in the same condition (p<0.01, Tukey test). (G) Thallus tips of WT and arf3 mutants grown for 2 weeks. Scale bars = 5 mm.