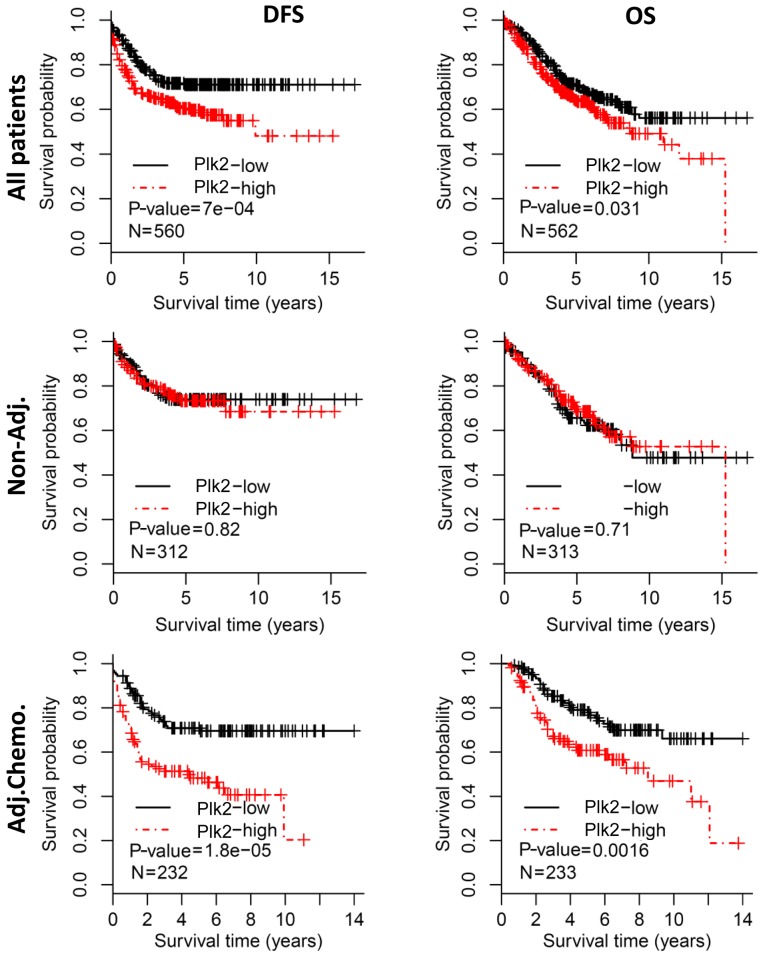
Figure 1.
Survival analysis of the expression of Plk2 in patients withcolorectal cancer. All patients were divided into Plk2-low and Plk2-high subgroups by the median expression levels of Plk2. Kaplan-Meier curves showed the survival differences of Plk2 subgroups based on DFS (left column) and OS (right column). Survival analysis was performed in all patients (upper panel), patients without adjuvant chemotherapy (middle panel) and patients who received adjuvant chemotherapy (bottom panel), respectively. The P-value was calculated by the log-rank test. Plk2, polo-like kinase 2; DFS, disease-free survival; OS, overall survival; non-Adj., without adjuvant chemotherapy; Adj.Chemo., with adjuvant chemotherapy.

