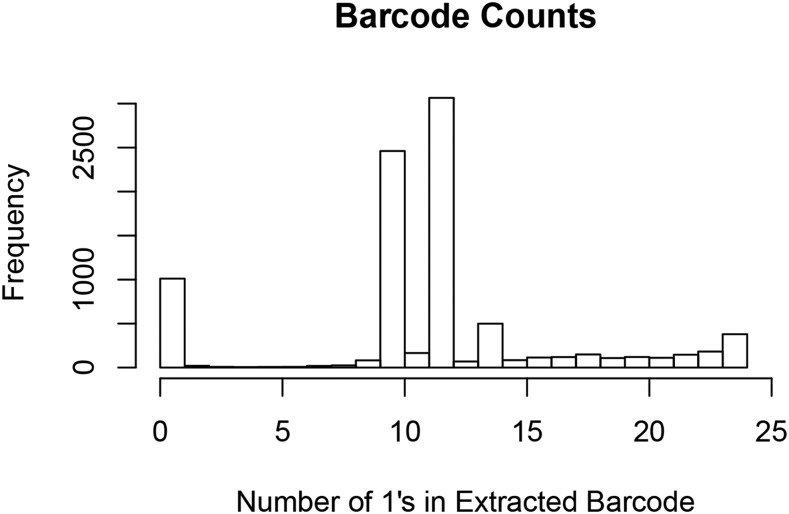
Figure 1.
Histogram of sequencing pools in which an insertion sequence was present in the Illumina sequencing run. The combinatorial mapping barcodes assigned each mutant to 10, 12, or 14 sequencing pools, evident as the major peaks in the histogram. Any sequence that was present in anything other than 10, 12 or 14 of the 24 possible sequencing pools could not be mapped to the library and was discarded from further analysis.

