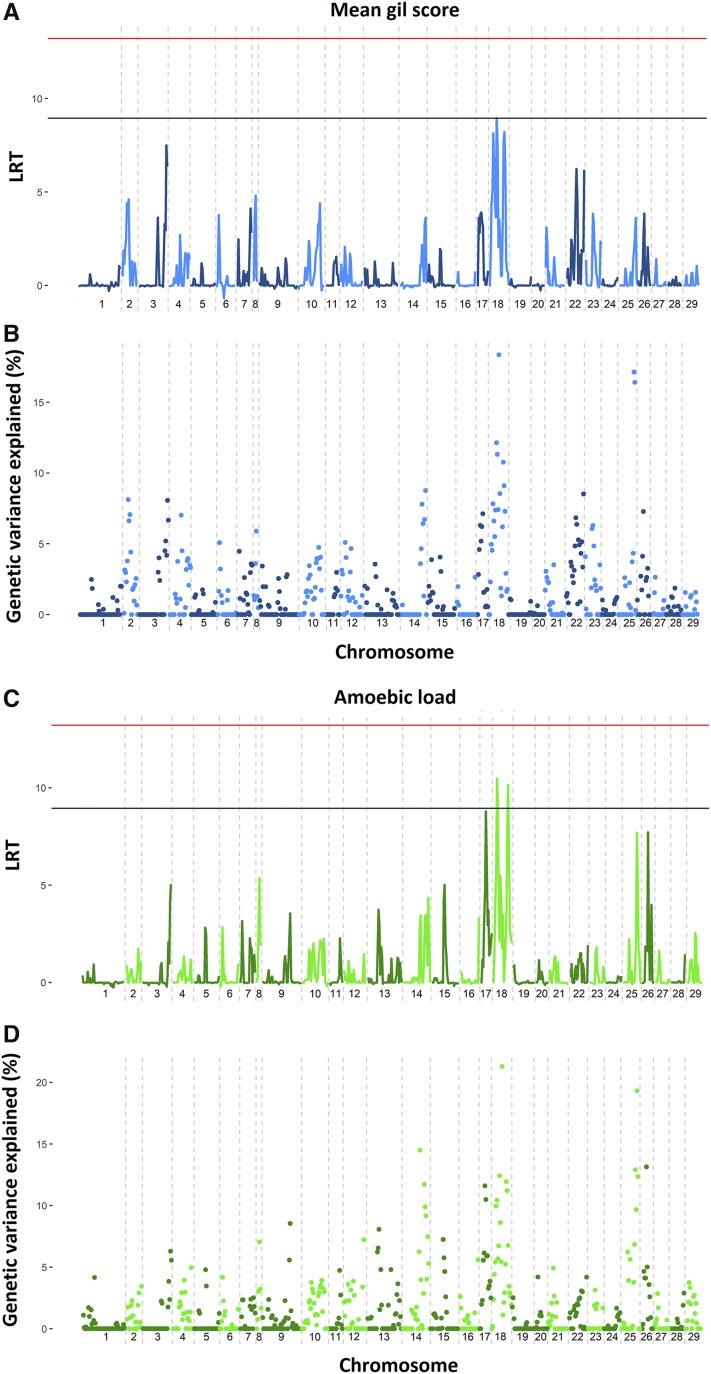
Figure 2.
Regional heritability mapping for AGD resistance. Regional heritability mapping results for mean gill score and amoebic load are shown. A) and C) represent the log-ratio test values for each tested region (20 consecutive SNPs) for mean gill score and amoebic load respectively, horizontal bars represent Bonferroni corrected significance (red) and nominal significance (black). B) and D) represent the percentage of additive genetic variance explained by each region for mean gill score and amoebic load repectively.

