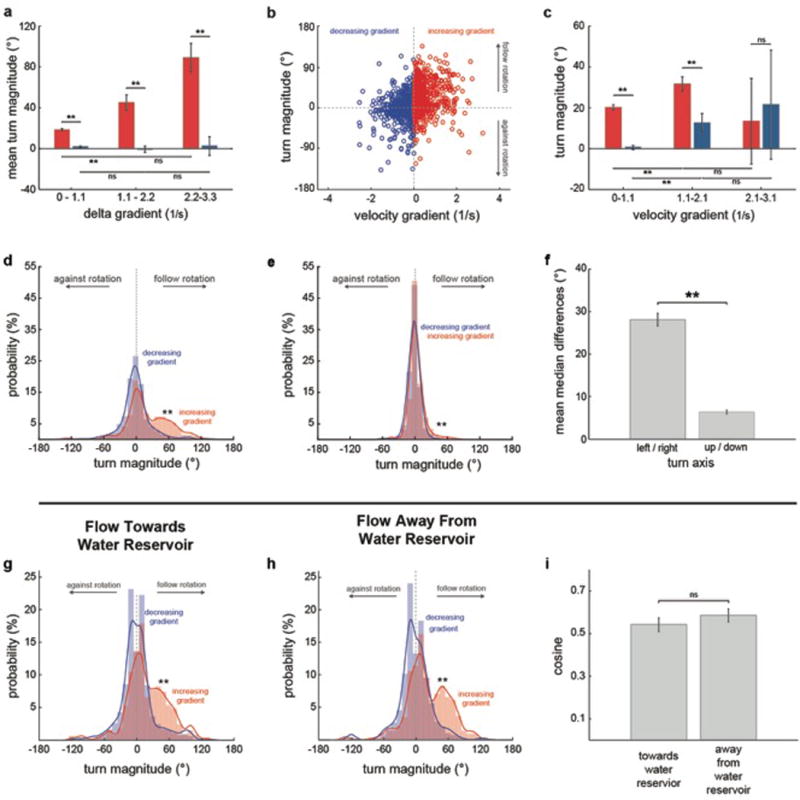
Extended Data Fig.4. The rheotactic algorithm depends on delta velocity gradients, is mainly composed of lateral turns and is independent of flow direction.

a, Mean turn magnitude for bouts occurring after increases or decreases in gradient magnitude, grouped by delta gradient. Data is the same as in Fig3, e. b, Scatter plot of absolute velocity gradient versus turn magnitude for bouts occurring at intermediate tube regions (0.36-0.74cm away from the walls) that can be reached from both low and high gradient areas. n = 13 fish, 1691 bouts. c, Mean turn magnitude for bouts following increases or decreases in gradient magnitude, grouped by absolute velocity gradient. Data is the same as in (b). d-e, Turn magnitude histogram for left/right (d) and up/down (e) turns. n = 13 fish, 341 trials. f, Mean difference between the medians of increasing and decreasing gradient turn distributions. Data is the same as in (d,e). g–i, Turn magnitude histogram for experiments in which water flowed towards (g) or away (h) from the water reservoir (ftwr and fawr conditions, respectively). n = 13 fish; 170 and 171 trials for ftwr and awr experiments, respectively. i, Cosine of the mean orientation for ftwr and fawr experiments. Data is the same as in (g,h). Means and ± s.e.m. (a,c,f,i) and bars and fitted lines (d,e,g,h) are shown. ns = p>0.05; ** = p<0.01; Kolmogorov- Smirnov (d,e,g,h) and Monte Carlo permutation (a,c,f,i) tests.
