
Figure2. Flow velocity gradients are the stimulus for rheotaxis in larval zebrafish.
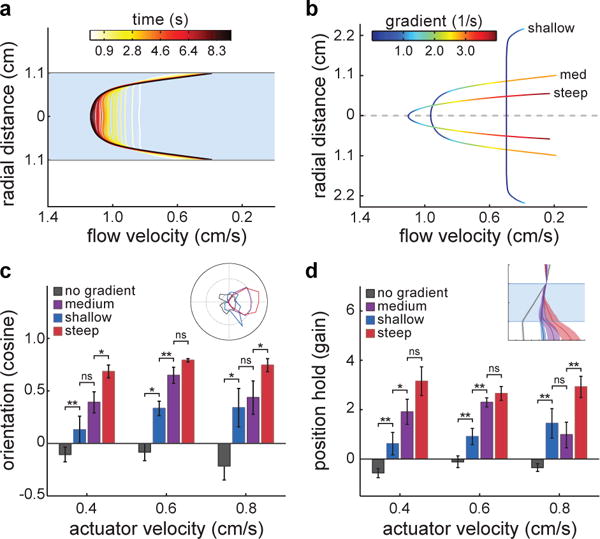
a, Development of the flow velocity profile obtained through Particle Image Velocimetry in the behavioral chamber. b, Flow velocity profiles and gradient magnitudes in different diameter tubes (see Methods). c, Cosine of the mean orientation for fish presented with different gradient conditions. Inset: Polar plot of fish orientation during flow stimulation. d, Gain for fish in each of the gradient conditions. Inset: Horizontal positions of fish from the observer’s point of view. n = 6 fish subjected to 6 trials at each actuator velocity (108 trials) for each gradient condition (432 trials total). Medium gradient values are the same as in Fig.1g,i. Data is shown as means ± s.e.m. ns = p>0.05; * = p>0.01&<0.05; ** = p<0.01; Monte Carlo permutation test.