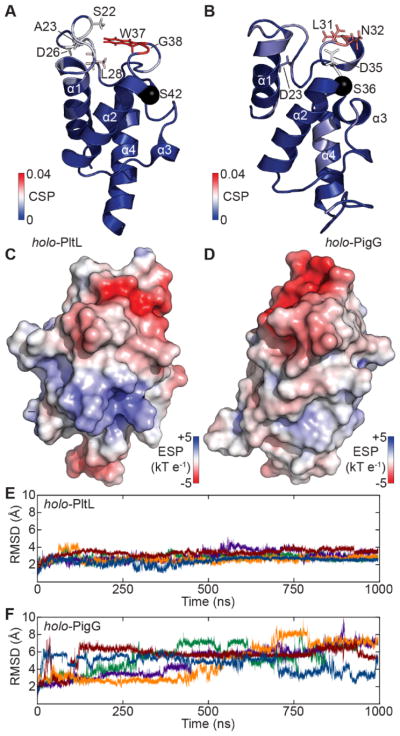
Figure 2.
The solution NMR structures and electrostatic potentials (ESPs) of PCPs. (A,B) Strucutre of holo-PltL and holo-PigG. Structure color maps represent the CSP in Figure 3. (C,D) ESPs of holo-PltL (C) and holo-PigG (D). (E,F) Backbone (heavy atom) root mean square deviations of holo-PltL (E) and holo-PigG (F). Data from 5 independent cMD simulations are colored uniquely.

