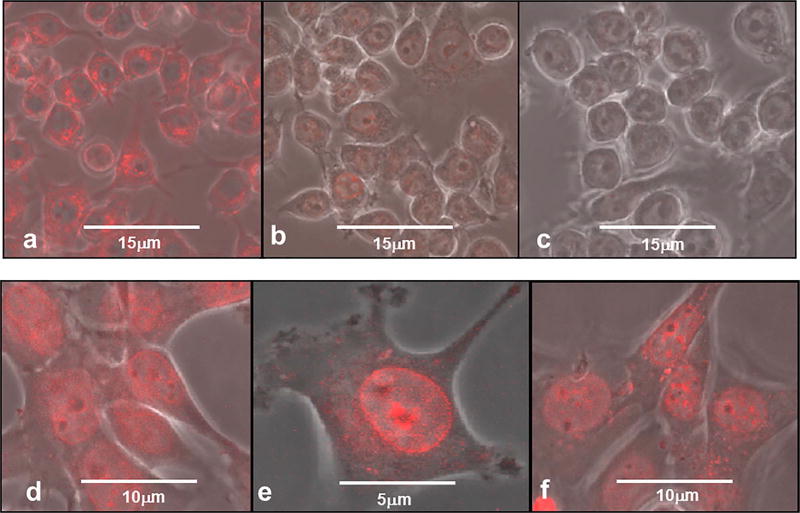
Fig. 2.
Confocal micrographs of drug release of DOX from MaDOX and F98. The cells were incubated with DOX: Ma 100 µg/ml for 2 min, F98 10 µg/ml for 30 min. DOX is shown by red fluorescence. (a) MaDOX, 15 min; (b) MaDOX, 120 min; (c) MaDOX, 180 min. (d) F98, 15 min; (e) F98, 15 min, with higher magnification (f) F98, 180 min. Scale bar as shown. (For interpretation of the references to colour in this figure legend, the reader is referred to the web version of this article.)

