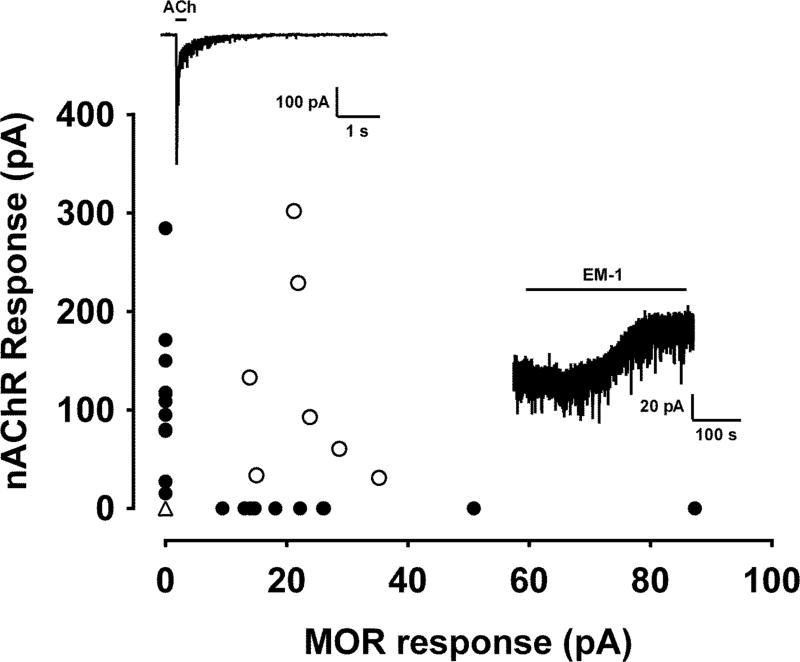
Figure 2. Functional nAChR and MOR expression distinguishes 2 major functional subclasses of PAG-RVM projection neurons.
Functional nAChR response plotted vs. MOR response magnitudes for 37 PAG-RVM projection neurons tested for responses to both ACh (3 mM; top inset) and endomorphin-1 (EM-1; 1 µM; bottom inset). Each symbol on the graph represents the magnitude of the response to focal ACh (y-axis) plotted against the magnitude EM-1 responses (x-axis) for each neuron. The filled circles represent those neurons with measurable responses to only one agonist, and the open circles represent the neurons that responded to both agonists. Note that the open triangle 0/0 data point represents 9 neurons that showed no response to either agonist.

