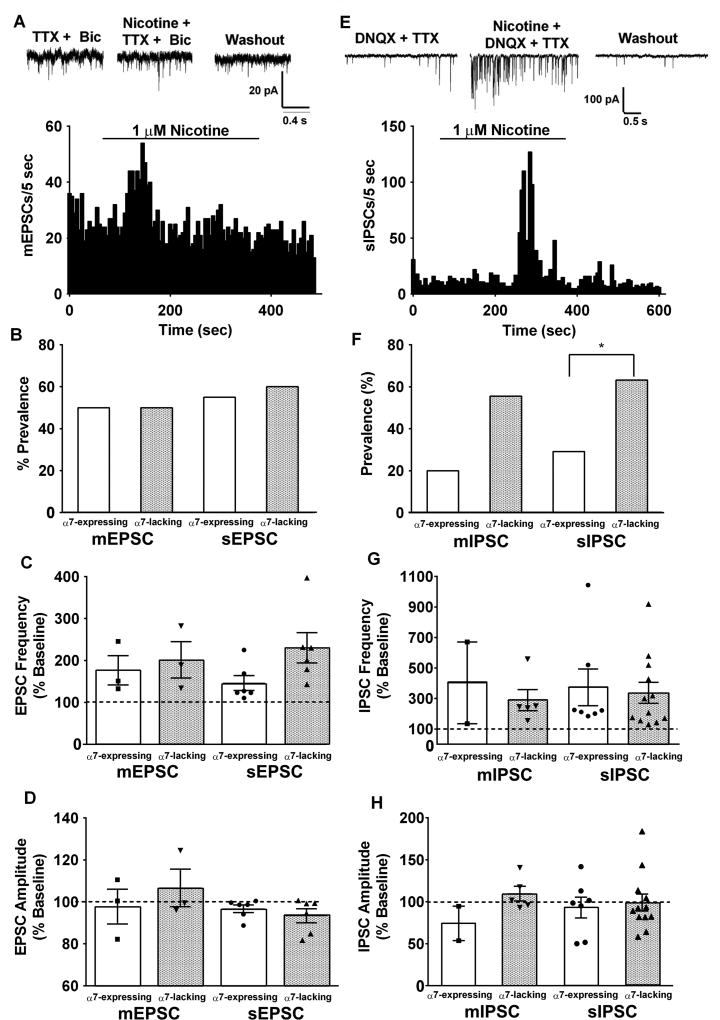
Figure 3. Non-α7 nAChRs enhance excitatory and inhibitory drive to α7-expressing and α7-lacking vlPAG neurons.
A. Example mEPSC raw traces recorded in the presence of TTX and bicuculline (Bic) during baseline, nicotine (1 µM) application, and washout. Example mEPSC frequency histogram from an α7-expressing neuron. B. Prevalence of nicotine-induced increase in EPSC frequency among α7-expressing and α7-lacking vlPAG neurons. Although nicotine enhances excitatory inputs to vlPAG projection neurons, the fraction of neurons that responded to nicotine with increases in either mEPSC or sEPSC frequency was nearly identical between α7-expressing (3/6, 6/11; white bars) and α7-lacking neurons (3/6, 6/10; gray bars). C. Summary of average nicotine-induced increases in EPSC frequency. Individual measurements are illustrated by the symbol scatterplots. There were no differences between groups. D. Summary of nicotine effects on average EPSC amplitudes for all groups. Nicotine did not alter EPSC amplitudes in any of the groups. E. Example mIPSC raw traces recorded in the presence of DNQX and TTX during baseline, nicotine application, and washout. Example sIPSC frequency histogram from an α7-lacking neuron. F. The fraction of neurons that responded to nicotine with enhanced mIPSC and sIPSC frequency was higher in α7-lacking neurons (5/9, 12/19; gray bars) than in α7-expressing neurons (2/10, 7/24; white bars) * p < 0.05. G. Summary of nicotine-induced changes in IPSC frequency. The α7-expressing and α7-lacking neurons showed similar average increases in IPSC frequency. H. There was no effect of nicotine on IPSC amplitude in any of the groups (bars represent Mean ± S.E.M of frequency/amplitude).

