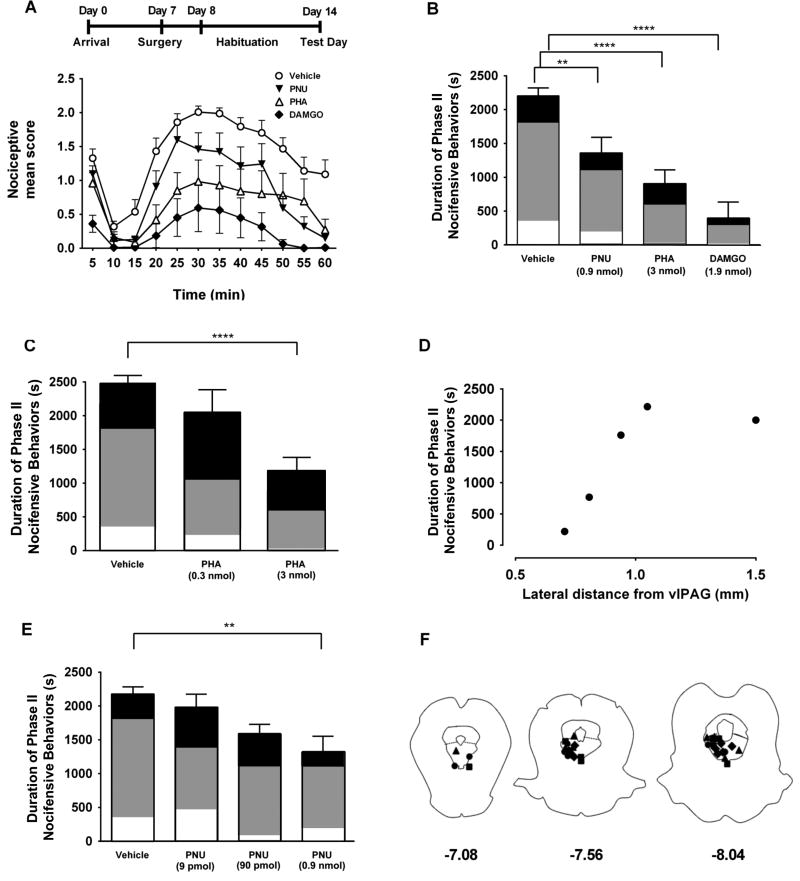
Figure 4. Intra-vlPAG administration of α7 nAChR agonist and PAM produces antinociception in the formalin assay.
A. (Top) Timeline of behavioral experiments. (Bottom) Time course of nociceptive mean scores following intraplantar injection of formalin in the left hindpaw. The curves illustrate responses during Phase I (0–10 min), interphase (10–15 min) and Phase II (15–60 min). Rats received focal injections into the vlPAG of either DAMGO (1.9 nmol, filled diamonds, n=8), PNU-120596 (0.9 nmol, inverted, filled triangles, n=8), or vehicle (open circles, n=13) followed 10 min later by the intraplantar formalin injection. The PHA-543613 infusion (3 nmol, open triangles, n=8) was administered 5 min before formalin injection. Each symbol represents the nociceptive mean score ± S.E.M, representing the time spent displaying nocifensive behavior during 5 min periods. B. Summary of nociceptive duration in the tonic phase (Phase II). Each bar represents the mean ± S.E.M. of the total time spent exhibiting nocifensive behaviors during Phase II (15–60 min after formalin injection). The shading within each bar illustrates the proportion of time favoring (white), lifting (gray), or licking (black). Holm-Sidak’s multiple comparisons test (relative to vehicle): ** p<0.01, **** p<0.0001. C. Summary of mean nociceptive duration for vehicle and two different concentrations of PHA-543613 (0.3 nmol n = 4; 3 nmol n = 8; **** p<0.0001) administered into the vlPAG. D. Duration of nociceptive responses during Phase II of the formalin test (y-axis) plotted versus the position of the injections of PHA-543613 (3 nmol) lateral to the vlPAG (x-axis). Each filled circle corresponds to an individual rat. E. Summary of mean nociceptive duration for vehicle and three different concentrations of PNU-120596 (9 pmol: n =4; 90 pmol: n = 5; ** p<0.01) administered into the vlPAG. F. Post-experiment determination of drug injection sites with fluorescent dye injections. Only those rats with dye located within the vlPAG were included in this study. Diamonds: DAMGO; Triangles: PHA-543613; Squares: PNU-120596, Circles: vehicle.

