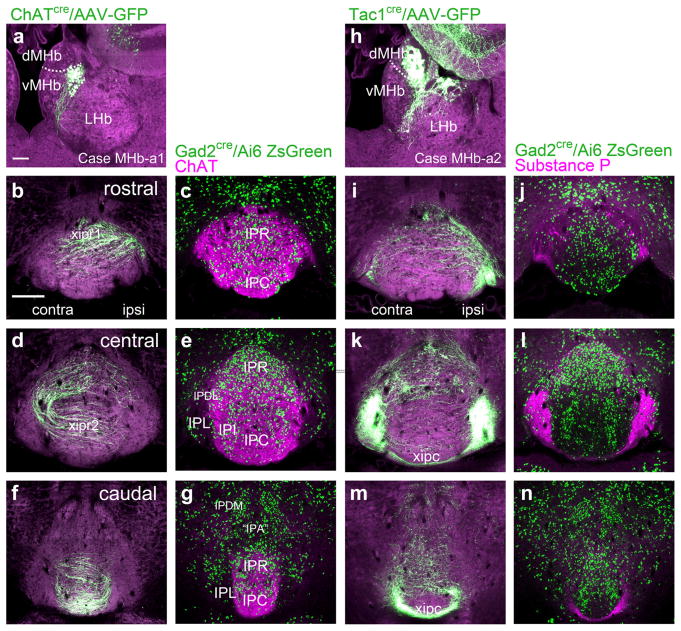
FIGURE 4.
Medial habenula projections onto the subnuclei of the interpeduncular nucleus. The map of MHb efferents onto IP subnuclei was examined using focal injections of Cre-dependent AAV-GFP into the MHb of ChATcre and Tac1cre mice, and by immunofluorescent staining for ChAT and SP (Tac1 gene product) in mice expressing a ZsGreen reporter in GABAergic neurons (Gad2cre/Ai6 reporter). Unilateral AAV labeling of a small cluster of neurons in each subnucleus allows the course of the fibers, including their decussations, to be traced, while immunofluorescent staining for ChAT and SP allows all of the afferent fibers and their terminals to be labeled. (a) AAV-GFP expression in case MHb-a1, a ChATcre mouse injected in the caudal vMHb (bregma −1.9). The labeled neurons reside in the dorsolateral part of vMHb. Dashed line indicates the dMHb/vMHb border. (b–g) vMHb projections in the rostral, central, and caudal IP, corresponding approximately to bregma −3.4, −3.7, and −3.9, respectively, (b, d, f) matched with the corresponding sections from a Gad2Cre/Ai6 reporter mouse stained for ChAT expression (c, e, g). In (b) vMHb fibers form the first (ipsilateral to contralateral) rostral interpeduncular decussation (xipr1), in (d) vMHb fibers form the second (contralateral to ipsilateral) rostral interpeduncular decussation (xipr2). (h) AAV-GFP expression in case MHb-a2, a Tac1Cre mouse injected in the central part of the dMHb (bregma −1.6). Dashed line indicates the dMHb/vMHb border. Some Tac1Cre-expressing neurons in the hippocampus are also labeled, but do not contribute to the IP projection. (i–n) dMHb projections at the stated levels of the IP (i, k, m) matched with the corresponding sections from a Gad2Cre/Ai6 reporter mouse stained for SP expression (j, l, n). In (m) projections from the dMHb form the caudal interpeduncular decussation (xipc). Scale: (a), 100 μm; (b) 200 μm [Color figure can be viewed at wileyonlinelibrary.com]

