FIGURE 5.
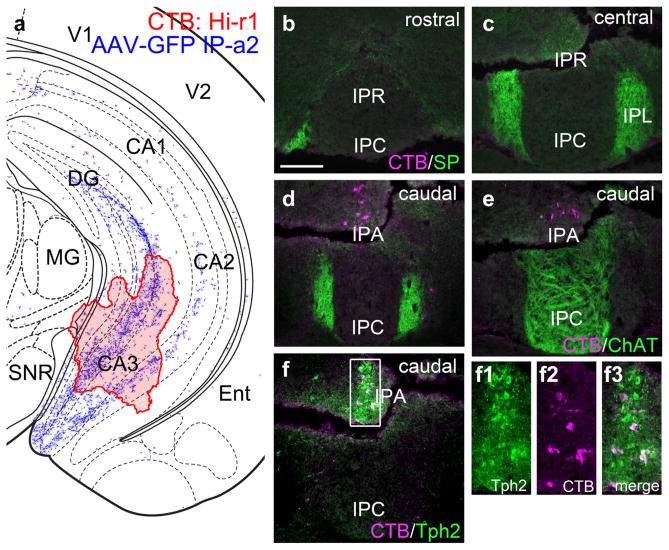
Interpeduncular nucleus projections to the hippocampus. (a) Map of the CTB injection site (red shaded area) for case Hi-r1, labeling the hippocampus, superimposed on the hippocampal area labeled anterogradely from the IP in case IP-a2 (blue fibers). The diagram corresponds to bregma −3.08 in a standard atlas. (b–d) Retrograde labeling of the IP at the designated levels. CTB-labeled neurons appear only in the most caudal part of the IP, IPA, which is not in the area receiving SP-labeled dMHb fibers. (e) Section adjacent to that shown in (d) labeled for CTB and ChAT. CTB-labeled neurons do not appear in the area receiving ChAT-labeled vMHb fibers. (f) Some CTB-labeled neurons are colabeled with Tph2, a marker of serotonergic raphe neurons (see also enlarged inset area). Damage to the fixed tissue evident in (c–f) did not result in tissue loss. Scale: (b), 200 μm [Color figure can be viewed at wileyonlinelibrary.com]

