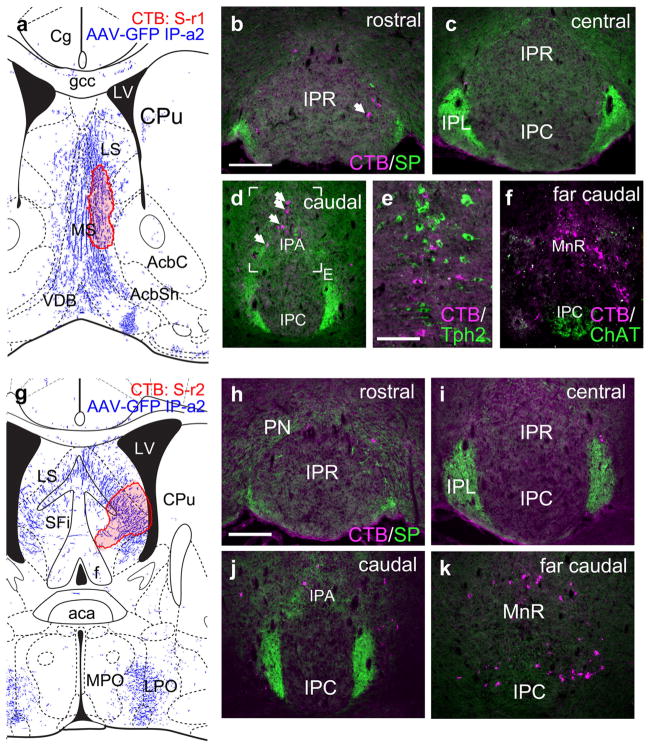
FIGURE 6.
Interpeduncular nucleus projections to the septal nuclei. (a) Map of the CTB injection site (red shaded area) for case S-r1, labeling the MS. The diagram corresponds to bregma +0.74 in a standard atlas. The pattern of anterograde tracing in IP-a2 is shown in blue. (b–d) Retrograde labeling of the IP at the designated levels. Arrow in (b) indicates a rare example of a labeled neuron within any of the principal subnuclei. Arrows in (d) indicate retrogradely labeled neurons in IPA. (e) Detail of a section adjacent to that shown in (d), labeled for CTB and Tph2, a marker of 5-HT neurons. The retrograde label marks cells which intermingle with 5-HT neurons. (f) Section of the far caudal IP labeled for CTB and ChAT, a marker of vMHb afferents. CTB-labeled cells are not detected within the habenulo-recipient area of the IP. (g) Map of the CTB injection site (red shaded area) for case S-r2, labeling the LS. The diagram corresponds to bregma +0.02 in a standard atlas. (h–k) Retrograde labeling of the IP at the designated levels. Labeled neurons are rarely detected within the principal subnuclei of the IP. Labeled neurons are detected adjacent to the most caudal part of the IP (k). Scale: (b, h), 200 μm; (e), 100 μm [Color figure can be viewed at wileyonlinelibrary.com]

