FIGURE 9.
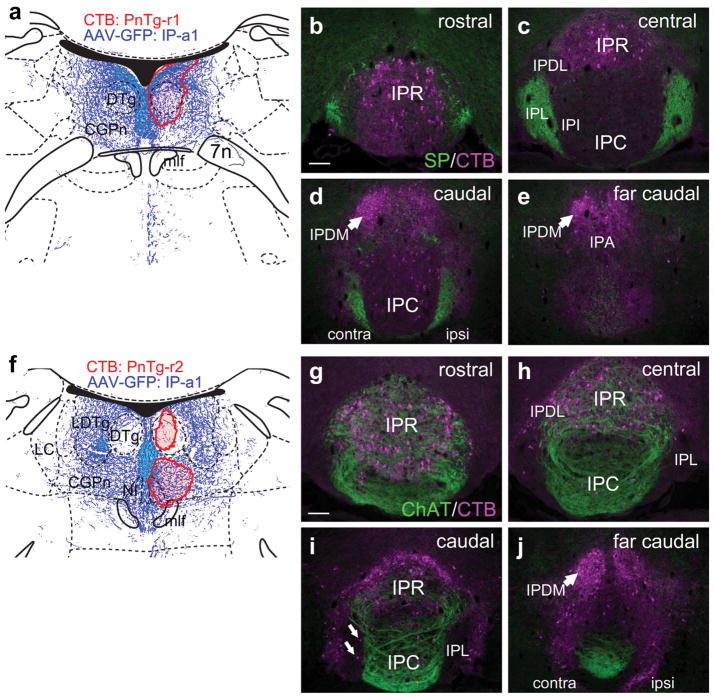
Interpeduncular nucleus projections to the medial pontine tegmentum. (a) Map of the CTB injection site (red shaded area) for the DTg and surrounding afferent IP fibers in case PnTg-r1. The diagram corresponds to bregma −5.68 in a standard atlas. (b–e) Retrograde labeling of IP subnuclei in case PnTg-r1. Labeling predominates in IPR and IPDM (arrows in d, e), and is sparse in IPC and IPL. Only rare labeled cells are seen in the IPL, containing dMHb fibers marked by SP. (f) Map of the two closely spaced CTB injection sites (red shaded area) for the CGPn and NI in case PnTg-r2. The diagram corresponds to bregma −5.40 in a standard atlas. (g–j) Retrograde labeling of IP subnuclei in case PnTg-r2. Most labeled cells are in the IPR and IPDL, containing vMHb fibers marked by ChAT. Only rare labeled cells are seen in the IPL (arrows, i). The IPDM is strongly labeled by CTB (j), but contains few MHb fibers. Scale: (b, g), 100 μm [Color figure can be viewed at wileyonlinelibrary.com]

