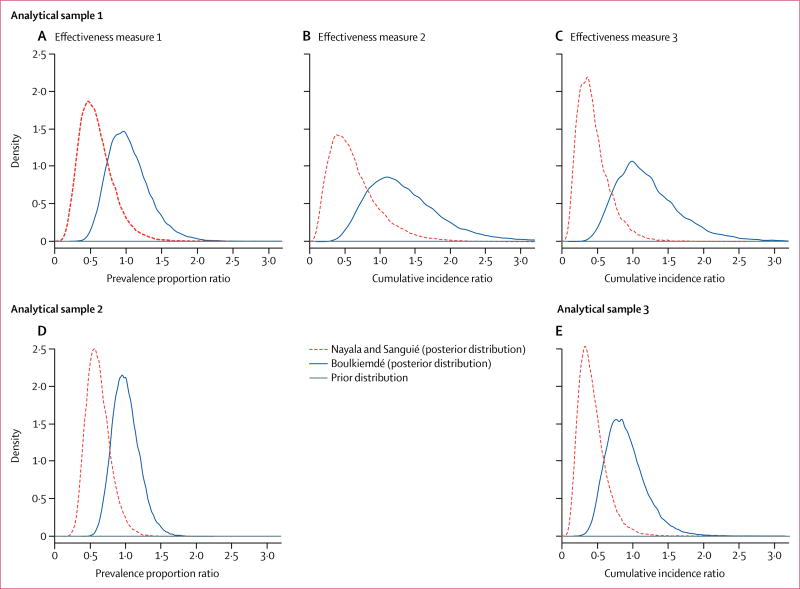
Figure 3. Prior and posterior distributions of the adjusted effect of the intervention in Boulkiemdé and in Nayala and Sanguié.
Variables adjusted for in the different models are reported in table 1. (A) Effectiveness measure 1 (prevalence proportion ratio adjusted for the change from baseline to the pre-randomisation period to the post-randomisation period and for clustering by village) and analytical sample 1 (participants provided a blood sample at all three visits). (B) Effectiveness measure 2 (cumulative incidence ratio adjusted for the change from seroconversion from the baseline to the pre-randomisation period and clustering by village) and analytical sample 1. (C) Effectiveness measure 1 and analytical sample 3 (participants provided blood samples at baseline and at the post-randomisation visit). (D) Effectiveness measure 1 and analytical sample 2 (participants provided a blood sample at least once). (E) Effectiveness measure 3 (cumulative incidence ratio from baseline to the post-randomisation visit) and analytical sample 3.

