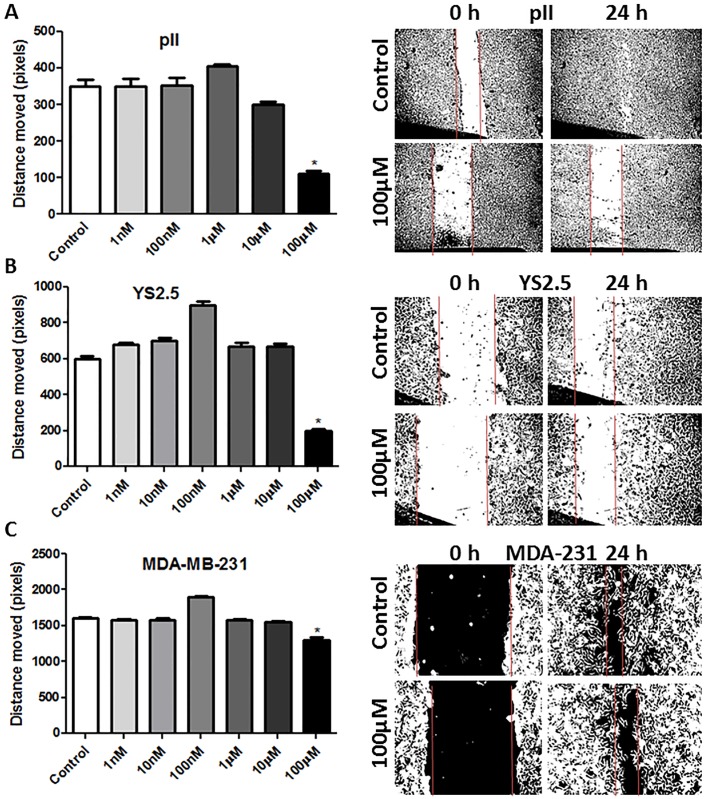
Fig 8. Effect of tetrahydroxyxanthone treatment on cell motility.
The mean distance moved (in pixels) as a measurement of cell motility for all cell lines treated with vehicle (control, open bars) or various concentrations of tetrahydroxyxanthone (1 nM- 100 μM) after 24 h of incubation. Histobars represent means ± SEM of at least 3 independent determinations. Asterisk denotes significant difference from control with p < 0.05. The photographs in the right panels represent an example of motility for each cell line.

