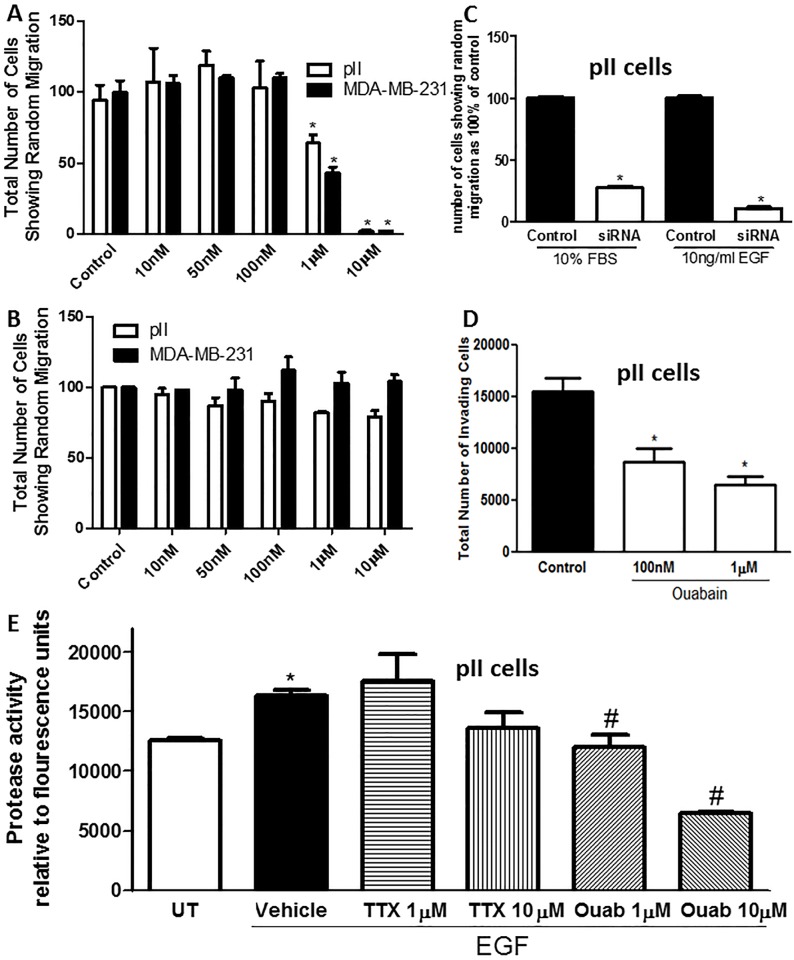
Fig 10. Effect of NKP inhibition on cell migration and invasion.
The number of pII (open bars) or MDA-MB-231 (solid bars) cells showing migration through agarose towards serum components; either pre-treated with vehicle (control) or various concentrations (10 nM and 10 μM) of ouabain (A) or tetrahydroxyxanthone (B). Panel C: number of pII cells showing migration through agarose towards serum components (10% FBS) or EGF (10 ng/ml); either treated with scrambled sequence (control, solid bars, taken as 100%) or NKP siRNA (48 h, open bars). Panel D: number of pII cells showing invasion through the matrigel towards serum components present in the lower chamber; either pre-treated with vehicle (control, solid bar) or various concentrations (100 nM and 1 μM) of ouabain (open bars). Panel E: total MMP activity determined in pII cells in response to EGF stimulation and ouabain or TTX pre-treatment. Histobars represent means ± SEM of at least 3 independent determinations. Asterisk denotes significant difference from control/UT, # denotes significant difference from EGF/vehicle treated pII cells with p < 0.05.

