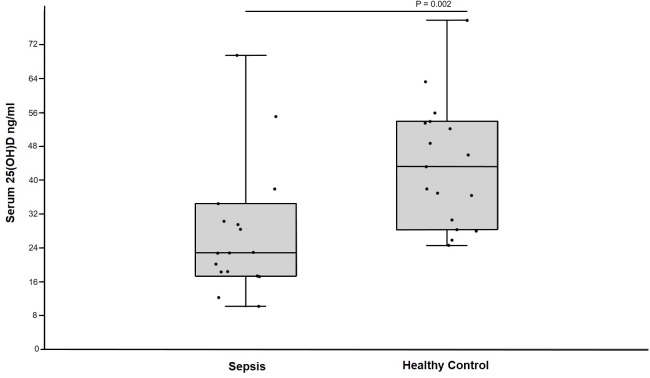
Fig 7. Box and whiskers plot comparing serum 25(OH)D concentrations in dogs with sepsis and healthy control dogs.
The boxes represent the 25th and 75th quartiles with the horizontal line representing the median. The whiskers represent the range of the data. The black circles represent results for individual dogs. Healthy control dogs (n = 17) had significantly greater serum 25(OH)D concentration than dogs with sepsis (n = 17).

