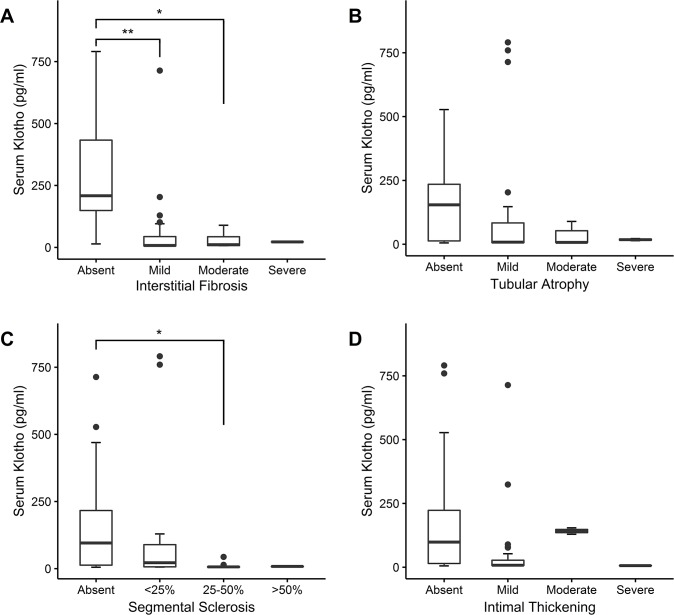
Fig 1. Comparison of serum klotho levels in different groups for each pathology.
Boxplots for serum klotho levels are presented according to the severity of each pathologic finding: (A) Interstitial fibrosis, (B) tubular atrophy, (C) segmental sclerosis of glomeruli, and (D) intimal thickening of arterial wall. *P < 0.01; **P < 0.001.

