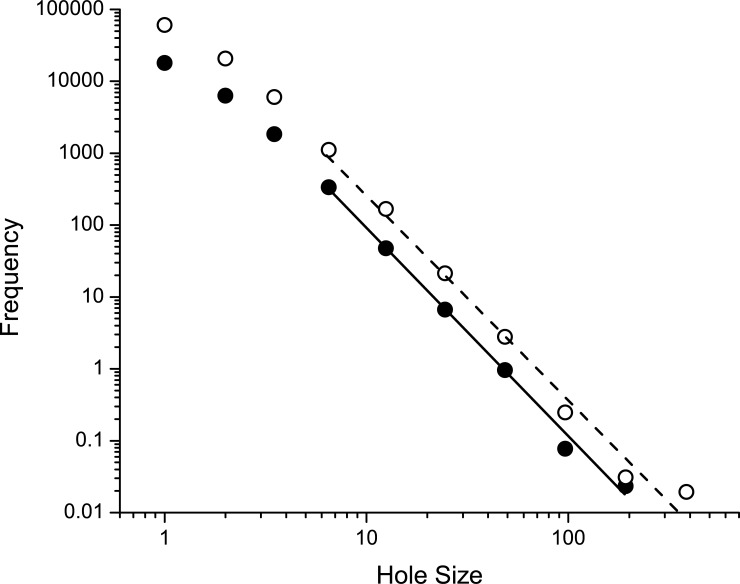
Fig 6. Rich-get-richer model predictions.
Histogram of hole diameters for the rich-get-richer simulation run until m = 30,000 (closed symbols) and m = 100,000 holes (open symbols). Straight lines were fit to each set of points after discarding the first 3 in each case. The slopes of the relationships beyond the first 3 points are -2.9 (SE 0.1) for m = 30,000 and -2.9 (SE 0.2) for m = 100,000.

