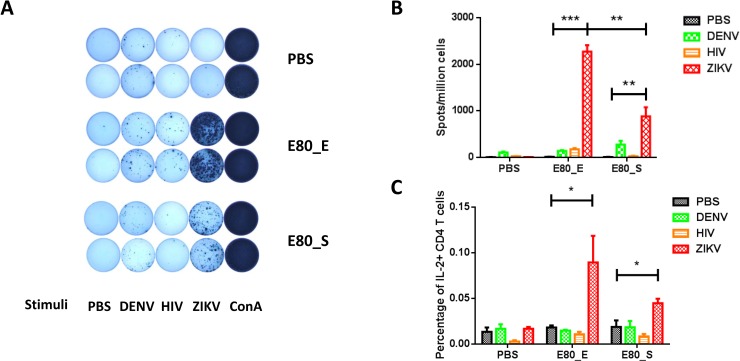
Fig 4. Measurement of antigen specific T cell responses by ELISPOT and ICS assays.
(A) Representative ELISPOT results. Splenocyte of PBS, 50μg E80_E and 50μg E80_S immunized mice were stimulated with PBS (lane 1), DENV E80 protein (lane 2), HIV synthesized polypeptide (lane 3), ZIKV E80 protein (lane 4) and Con A (lane 5). (B) Summary of the ELISPOT results. Splenocytes were cultured at 37°C for 48 hours with the same dose of (10μg/ml) ZIKV E protein, DENV E protein, HIV protein or PBS. IFNγ ELISPOT assay was performed to quantify antigen specific T cells at 48 hours after stimulation. (C) Summary of the ICS results. Splenocytes from immunized mice were stimulated with either 10μg/ml of ZIKV E protein, or 10μg/ml of DENV E proteins, or 10μg/ml of HIV protein or PBS for 6 hours. Golgi stop was supplemented 2 hours after stimulation. Statistical differences were analyzed by Student’s t tests. Different p values were indicated by * (p<0.05), or ** (p<0.01), or *** (p<0.001). The data were presented as mean ± SEM. The figures are representative results of 2 independent experiments. In ELISPOT assay, each sample was assayed in duplicates; in ICS assay, each sample was measured once.

