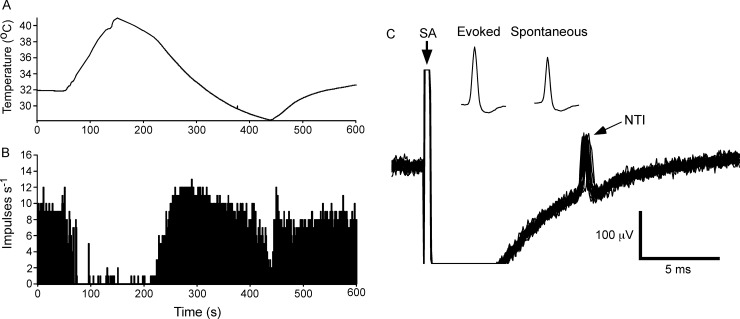
Fig 1. The electrical activity recorded from a cold thermoreceptor nerve terminal at the corneal surface.
A and B, show the temperature of the solution superfusing the cornea (A) and the frequency of nerve terminal impulse (NTI) discharge (B). During heating and cooling the frequency of NTIs was decreased and increased, respectively. C, overlaid traces recorded during stimulation of the ciliary nerves with a train of 25 pulses at 1 Hz. At this recording site electrical stimulation evoked a single stimulus locked NTI. The insets in C show averages of the electrically evoked and spontaneous NTIs. The smaller amplitude of the spontaneous NTIs indicates they are likely to be initiated very close to site of recording (see [25]). In C, the stimulus artifact (SA) is indicated and during the flat line immediately following the SA the signal was out of the analogue-to-digital recording range.

