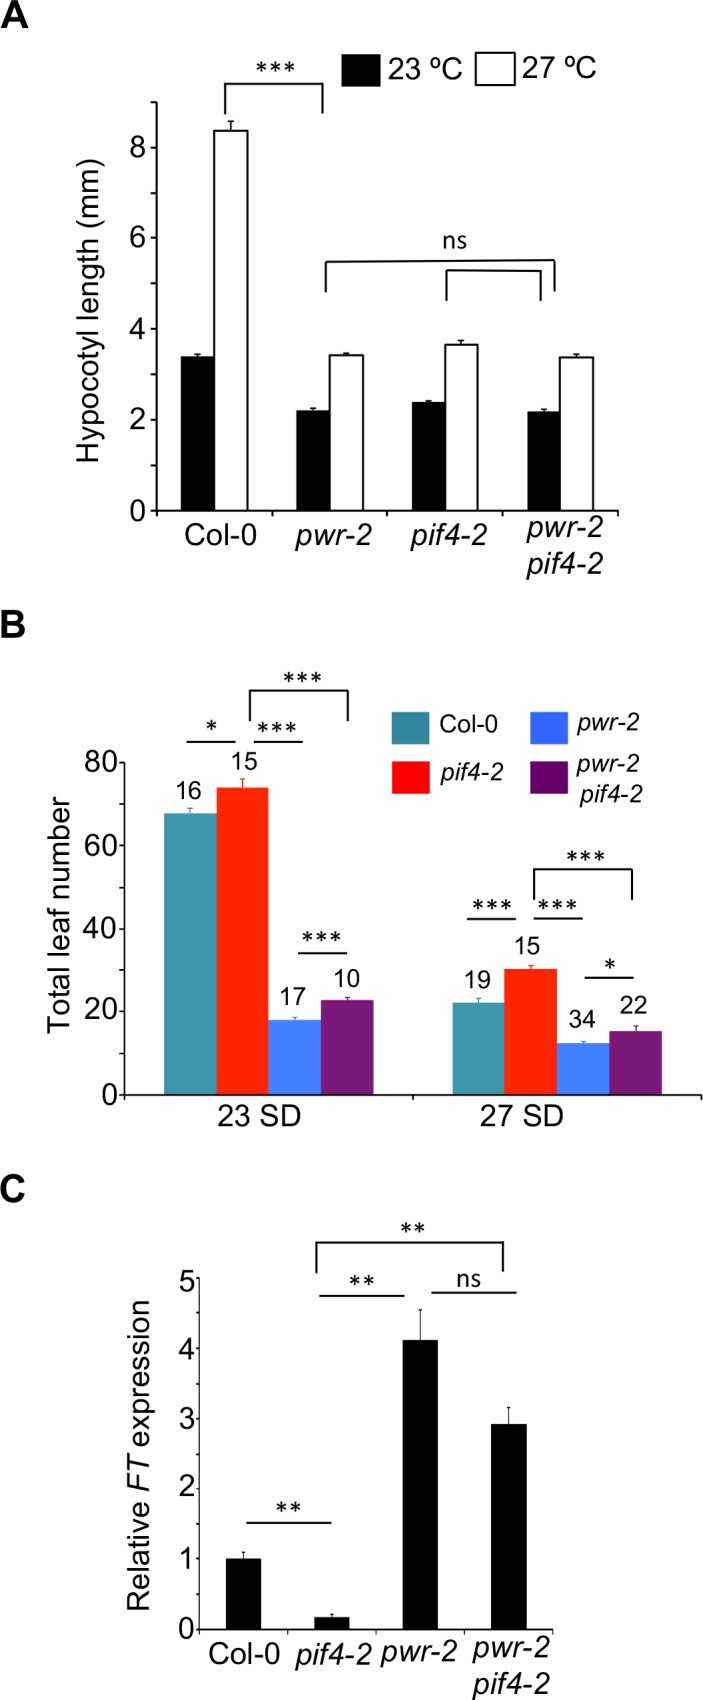
Fig 2. PWR acts upstream of PIF4.

A) Hypocotyl lengths of various genotypes at 23°C and 27°C. p-values for the corresponding GxE interactions determined through ANOVA are shown. B) Flowering time measured as total leaf number in pif4-2 pwr-2 double mutants compared to single mutants at two different temperatures in short days (please see S4 Fig for the data with pif4-101). Number of plants and the p-values determined by Student’s t-test are shown above bar graphs. C) Relative FT expression levels in different genotypes at 27°C. The data is normalized against the Col-0 reference with TUBULIN as internal control. Error bars represent standard error. p-values: ***<0.0001, **<0.001, *<0.05, ns = not significant.
