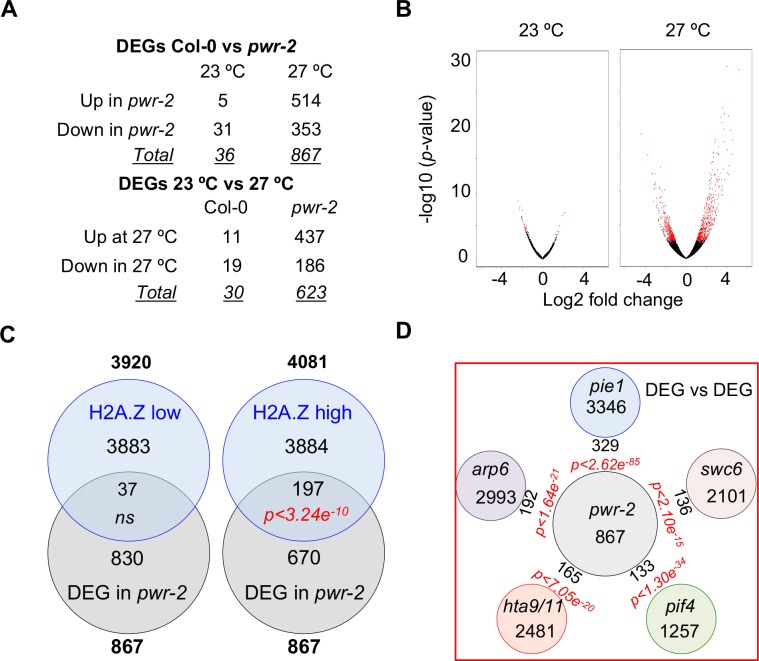
Fig 4. Transcriptome analysis suggests a link between PWR-mediated histone deacetylation and H2A.Z nucleosome dynamics.
A) Number of DEGs (padj<0.05) between Col-0 and pwr-2 in seedlings grown at 23°C and/or shifted to 27°C for 2-hours. B) Volcano plots revealing massive mis-regulation of the pwr-2 transcriptome at high temperatures. Red dots represent DEGs between pwr-2 and Col-0. C) Overlap of DEGs between pwr-2 and Col-0 at 27°C with genes that are low-H2A. Z or high-H2A.Z enriched in gene bodies. Total number of DEGs is shown in bold. The H2A.Z data are from [9]. D) Overlap of DEGs between pwr-2 and Col-0 at 27°C with DEGs in pie1, swc6, arp6, hta9/hta11 and pif4.

