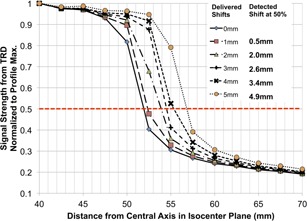
Figure 7.

1D profile of TRD measurement along one leaf. Different lines represent multiple manually introduced static MLC leaf position deviations from 1 mm to 5 mm. The legend provides a comparison between delivered shift and detected shift based on the location of 50% signal strength.
